图形
坐标轴是一种带有自身数字的 mobject。可以用它来绘制函数图像或数据图。
坐标轴与图像
import manimgx as m


def square(x: float) -> float:
    return x**2


class Parabola(m.Scene):
    def construct(self) -> None:
        axes = m.Axes(x_range=[-3, 3, 1], y_range=[0, 9, 3], x_length=8, y_length=5)
        axes.add_coordinates()
        graph = axes.plot(square, color=m.BLUE)
        self.play(m.Create(axes))
        self.play(m.Create(graph))
x_range=[-3, 3, 1]在 x 轴上放置从 −3 到 3 的数字,每隔 1 一个刻度。y_range对 y 轴做同样的事。x_length和y_length设置坐标轴的长度,单位为帧的单位。add_coordinates在刻度处写上数字。axes.plot绘制一个以x为自变量的 Python 函数的图像。
坐标轴自身的数字
坐标轴有自己的坐标。在上面的图像中,x 为 2 且 y 为 4 的点在帧中并不位于 [2, 4, 0]。axes.c2p(2, 4)("coordinates to point",坐标到点)给出该点在帧中的位置。可以用它把 mobject 放到图像上:
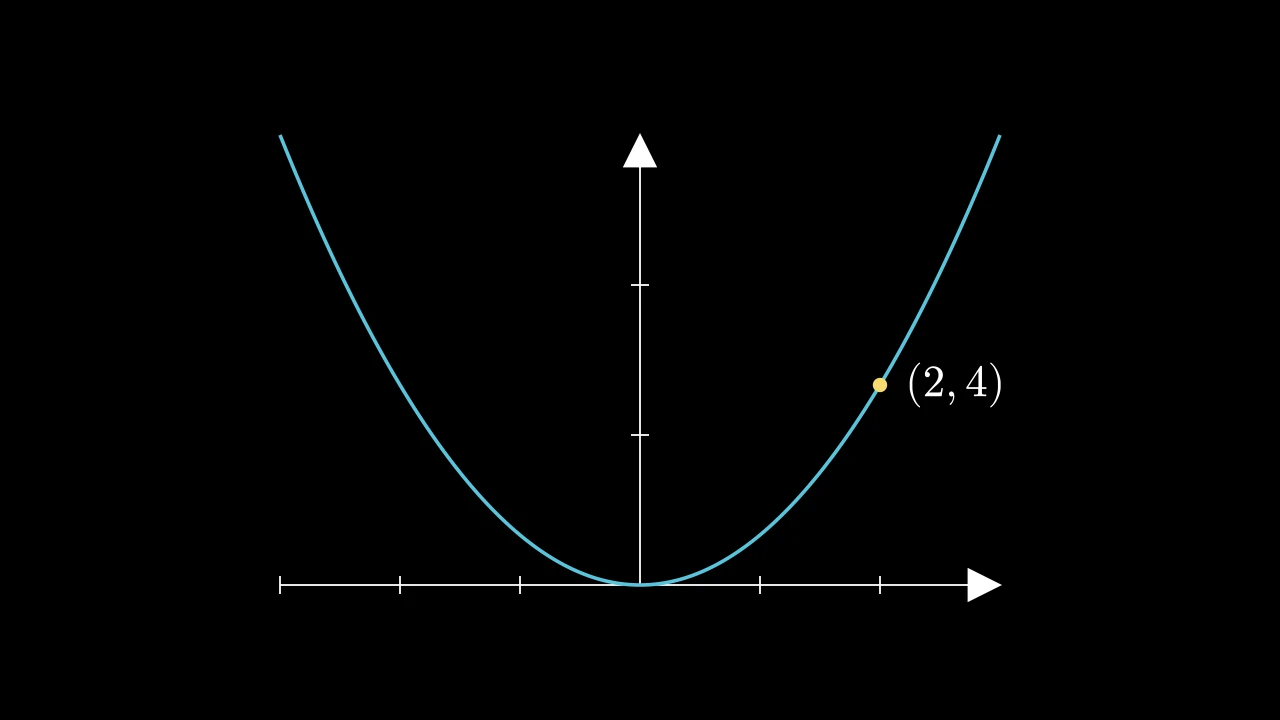
import manimgx as m


def square(x: float) -> float:
    return x**2


class OnTheGraph(m.Scene):
    def construct(self) -> None:
        axes = m.Axes(x_range=[-3, 3, 1], y_range=[0, 9, 3], x_length=8, y_length=5)
        graph = axes.plot(square, color=m.BLUE)
        dot = m.Dot(axes.c2p(2, 4), color=m.YELLOW)
        label = m.MathTex("(2, 4)")
        label.next_to(dot, m.RIGHT)
        self.add(axes, graph, dot, label)
标签与面积
坐标轴可以生成用于解释图像的各个部分:
import manimgx as m


def curve(x: float) -> float:
    return x**2 / 4


class Area(m.Scene):
    def construct(self) -> None:
        axes = m.Axes(x_range=[0, 4, 1], y_range=[0, 4, 1], x_length=8, y_length=5.5)
        axes.add_coordinates()
        names = axes.get_axis_labels("x", "y")
        graph = axes.plot(curve, color=m.BLUE)
        label = axes.get_graph_label(graph, r"y = \frac{x^2}{4}", x_val=4)
        area = axes.get_area(graph, x_range=[1, 3], opacity=0.5)
        self.play(m.Create(axes), m.Write(names))
        self.play(m.Create(graph), m.Write(label))
        self.play(m.FadeIn(area))
        self.wait()
get_axis_labels为坐标轴命名。get_graph_label在图像的末端或x_val处写一个 LaTeX 标签。get_area填充图像下方、介于两个x值之间的面积。
这些方法会生成新的 mobject。可以像示例那样把它们添加到场景中,或对其进行动画。
m.NumberPlane(),即 位置 中的网格,也是坐标轴:填满整个帧、使用帧自身坐标的坐标轴。绘图参考 展示了各种坐标轴和图像。
下一步
更新器 展示了如何让一个 mobject 跟随另一个 mobject,例如一个沿图像移动的点。