跳转至

图表

影片代码
import manimgx as m


class ChartsHero(m.Scene):
    def construct(self) -> None:
        chart = m.BarChart(
            [3, 5, 2, 6, 4], bar_names=["A", "B", "C", "D", "E"], y_range=[0, 8, 2]
        )
        self.play(m.Create(chart))
        self.play(chart.animate.change_bar_values([5, 2, 6, 3, 7]), run_time=2)
        self.wait()

柱状图是带有每根柱子对应一个值的坐标轴,柱子会随值的变化而生长和收缩。样本空间是一个代表一次随机事件所有可能结果的矩形:将其划分为若干部分,各部分的面积即为对应的概率。
BarChart

BarChartExample
代码
import manimgx as m


class BarChartExample(m.Scene):
    def construct(self) -> None:
        chart = m.BarChart(
            values=[-5, 40, -10, 20, -3],
            bar_names=["one", "two", "three", "four", "five"],
            y_range=[-20, 50, 10],
            x_length=10,
            y_length=6,
            x_axis_config={"font_size": 36},
        )
        self.add(chart)

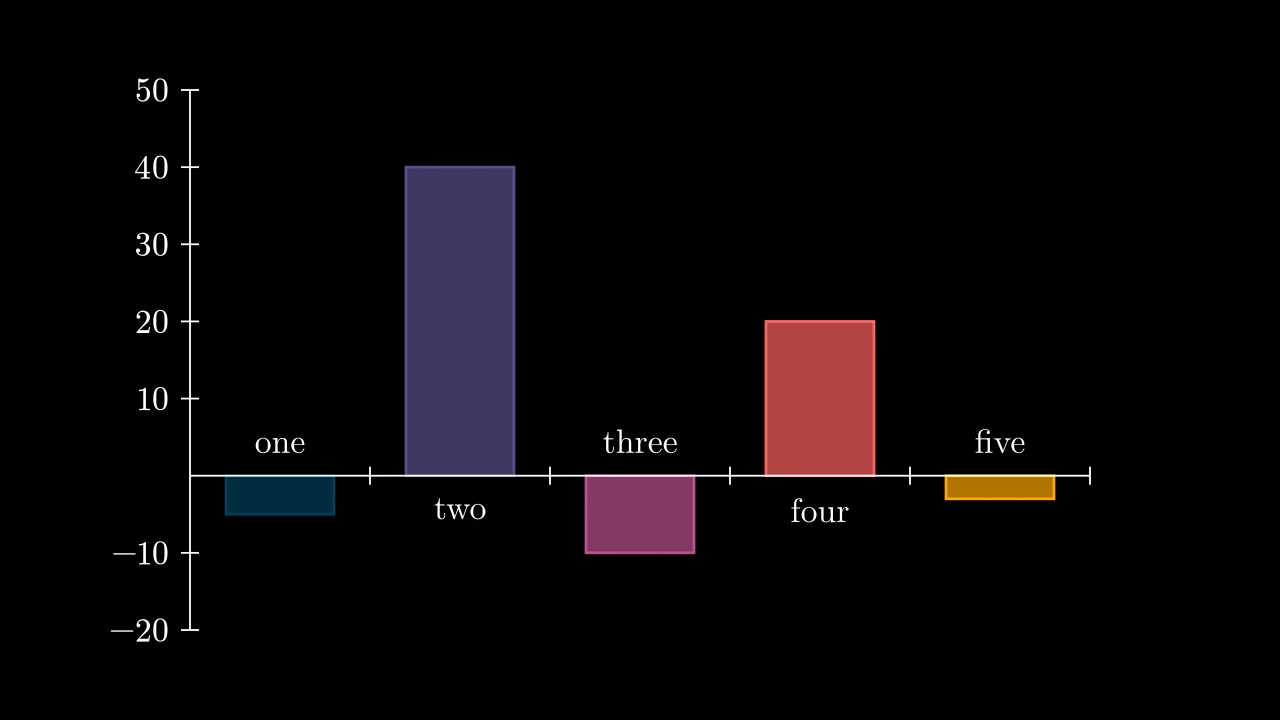
条形图:每个值一个条,从 x 轴升起(负值则悬挂在其下方),在带编号 y 轴的坐标轴上;条沿渐变着色。

每个条位于其自身的 x 轴单位中,居中于其中,宽为其 bar_width,高为其值(以 y 轴单位计)。条的名称在 x 轴下方(负条下方则在上方)。 change_bar_values 改变条,get_bar_labels 在其旁写其值。该图是 Axes:其 x 轴从 0 运行到条数。

m.BarChart(values, bar_names=None, y_range=None, x_length=None, y_length=None, bar_colors=('#003f5c', '#58508d', '#bc5090', '#ff6361', '#ffa600'), bar_width=0.6, bar_fill_opacity=0.7, bar_stroke_width=3, **kwargs)
values

值,每个条一个,从左到右。

bar_names

条的名称,由 x 轴书写,按文本排版;None 表示无。

y_range

y 轴的范围,[y_min, y_max, y_step];None 表示适应值,从 0(或最低值,若为负)到最高值(或 0),步长约一个场景单位。给定两个数字时,步长即为那个。

x_length

x 轴的长度,以场景单位计;None 表示每条一个场景单位,至多画框宽度减 2。

y_length

y 轴的长度,以场景单位计;None 表示 4,即画框高度减 4。

bar_colors

条的颜色:从左到右的渐变。

bar_width

每个条的宽度,作为其 x 轴单位的分数。

bar_fill_opacity

条的填充不透明度,从 0 到 1。

bar_stroke_width

条轮廓的宽度,以场景单位的百分之一计。

axis_config

每个坐标轴的 数轴关键字:include_numbers、font_size、color、…(默认 None:无)。

x_axis_config

x 轴的数轴关键字,覆盖 axis_config 的(默认 None:无)。

y_axis_config

y 轴的数轴关键字,覆盖 axis_config 的(默认 None:无)。

tips

每个坐标轴末端是否有箭头(默认 True;平面的坐标轴无箭头,除非 axis_config 包含 include_tip)。

color

填充与描边共用的颜色(默认白色);None 表示该类的默认值。

fill_color

填充的颜色;未给出时为 color。多个颜色沿 sheen_direction 构成渐变。

fill_opacity

填充的不透明度,取值从 0 到 1(默认 0:无填充)。

stroke_color

描边的颜色;未给出时为 color。多个颜色构成渐变。

stroke_opacity

描边的不透明度,取值从 0 到 1(默认 1)。

stroke_width

描边的宽度,以场景单位的百分之一计(默认 4;0:无描边)。

background_stroke_color

绘制于填充之后的轮廓颜色(默认黑色)。

background_stroke_opacity

轮廓的不透明度,取值从 0 到 1(默认 1)。

background_stroke_width

轮廓的宽度,以场景单位的百分之一计(默认 0:无)。

sheen_factor

颜色朝 sheen_direction 变亮的程度,取值从 -1 到 1(默认 0); 负值变暗。

sheen_direction

颜色变亮的方向(默认 UL)。

joint_type

描边在路径转折处的连接方式:圆角、斜切或斜接,按二维场景的绘制方式 (参见 LineJointType;默认 AUTO:斜接)。

cap_style

描边在其显示的每一端的端点样式(开放路径的端点、虚线的端点):圆头、平头 或方头,按二维场景的绘制方式(参见 CapStyleType;默认 AUTO:平头)。

shade_in_3d

三维场景的光是否对该 mobject 着色。

material

其表面在三维场景中如何反射场景的光(参见 Material);None:Manim 的着色(默认)。

name

mobject 的名称;未给出时为其类名。

z_index

其在绘制顺序中的位置:索引较高者绘制于较低者之上 (默认 0)。

target

MoveToTarget 将 mobject 移动至的状态。

源码

manimgx\mobjects\plotting.py

def __init__(
    self,
    values: Sequence[float],
    bar_names: Sequence[str] | None = None,
    y_range: Sequence[float] | None = None,
    x_length: float | None = None,
    y_length: float | None = None,
    bar_colors: Iterable[ParsableManimColor] = (
        "#003f5c",
        "#58508d",
        "#bc5090",
        "#ff6361",
        "#ffa600",
    ),
    bar_width: float = 0.6,
    bar_fill_opacity: float = 0.7,
    bar_stroke_width: float = 3,
    **kwargs: Unpack[AxesOptions],
):
    y_length = y_length if y_length is not None else config.frame_height - 4
    self.values = list(values)
    """图表的值,每个条一个,按当前状态。"""
    self.bar_names = bar_names
    self.bar_colors = list(bar_colors)
    self.bar_width = bar_width
    self.bar_fill_opacity = bar_fill_opacity
    self.bar_stroke_width = bar_stroke_width
    x_range = [0, len(self.values), 1]
    if y_range is None:
        y_range = [
            min(0, min(self.values)),
            max(0, max(self.values)),
            round(max(self.values) / y_length, 2),
        ]
    elif len(y_range) == 2:
        y_range = [*y_range, round(max(self.values) / y_length, 2)]
    if x_length is None:
        x_length = min(len(self.values), config.frame_width - 2)
    kwargs["x_axis_config"] = merged_axis_config(
        {"font_size": 24, "label_constructor": Tex}, kwargs.get("x_axis_config")
    )
    kwargs.setdefault("tips", False)
    self.bars: VGroup = VGroup()
    """条,矩形,从左到右。"""
    self.x_labels: VGroup | None = None
    self.bar_labels: VGroup | None = None
    super().__init__(
        x_range=x_range,
        y_range=y_range,
        x_length=x_length,
        y_length=y_length,
        **kwargs,
    )
    self._add_bars()
    if self.bar_names is not None:
        self._add_x_axis_labels()
    self.y_axis.add_numbers()

values

图表的值,每个条一个,按当前状态。

bars

条,矩形,从左到右。

get_bar_labels

BarChartGetBarLabelsExample
代码
import manimgx as m


class BarChartGetBarLabelsExample(m.Scene):
    def construct(self) -> None:
        chart = m.BarChart(
            values=[9, 7, 4, 3, 1],
            y_range=[0, 10, 2],
            x_length=10,
            y_length=5,
            bar_colors=[m.BLUE, m.GREEN, m.YELLOW],
        )
        self.add(chart, chart.get_bar_labels(font_size=40))

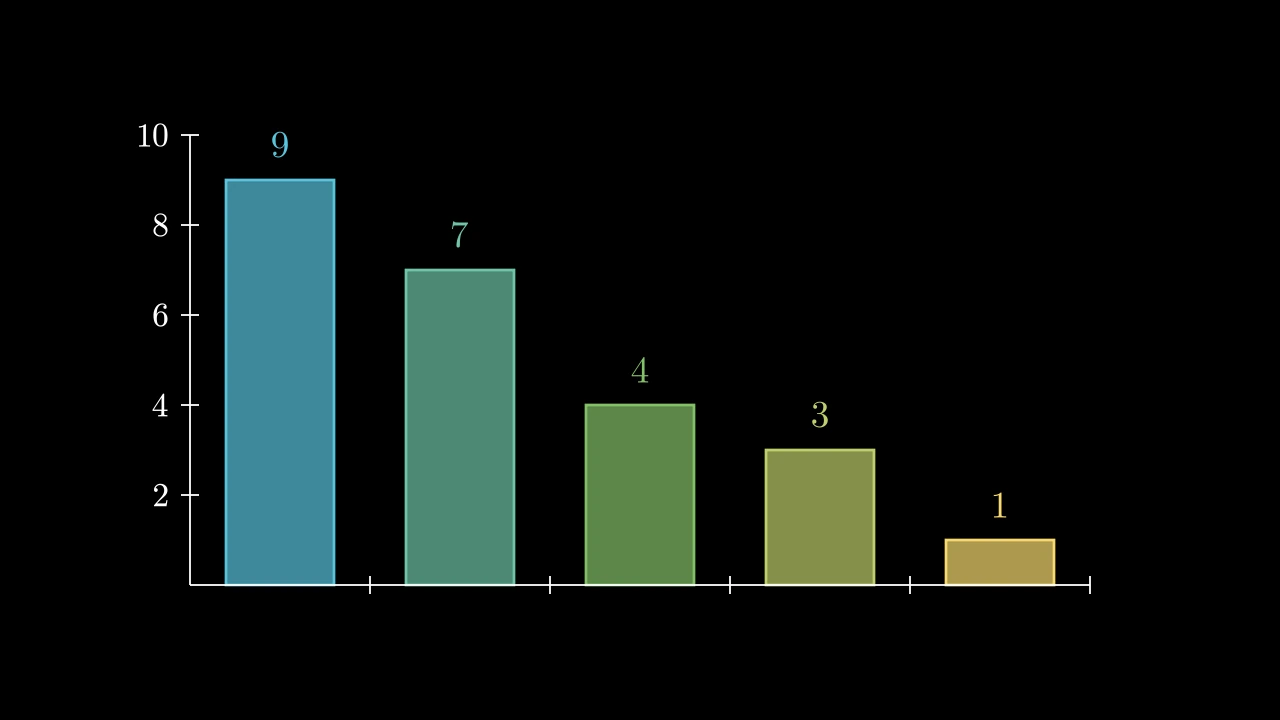
制作条值的标签:每个在其条上方(负值在下方),采用条的颜色,除非给出其他颜色。

bar_chart.get_bar_labels(color=None, font_size=24, buff=MED_SMALL_BUFF, label_constructor=Tex)
color

标签的颜色;None 表示每个条的填充颜色。

font_size

它们的字号。

buff

每个条与其标签之间的间距,以场景单位计。

label_constructor

它们的排版类:Tex、MathTex、…。

返回 标签的新组,从左到右,未添加到图表。

源码

manimgx\mobjects\plotting.py

def get_bar_labels(
    self,
    color: ParsableManimColor | None = None,
    font_size: float = 24,
    buff: float = MED_SMALL_BUFF,
    label_constructor: type[ManimTextLabel] = Tex,
) -> VGroup:
    """制作条值的标签:每个在其条上方(负值在下方),采用条的颜色,除非给出其他颜色。

    Args:
        color: 标签的颜色;None 表示每个条的填充颜色。
        font_size: 它们的字号。
        buff: 每个条与其标签之间的间距,以场景单位计。
        label_constructor: 它们的排版类:[Tex][manimgx.Tex]、[MathTex][manimgx.MathTex]、…。

    Returns:
        标签的新组,从左到右,未添加到图表。

    Examples:
        ```python
        import manimgx as m


        class BarChartGetBarLabelsExample(m.Scene):
            def construct(self) -> None:
                chart = m.BarChart(
                    values=[9, 7, 4, 3, 1],
                    y_range=[0, 10, 2],
                    x_length=10,
                    y_length=5,
                    bar_colors=[m.BLUE, m.GREEN, m.YELLOW],
                )
                self.add(chart, chart.get_bar_labels(font_size=40))
        ```
    """
    bar_labels = VGroup()
    for bar, value in zip(self.bars, self.values, strict=False):
        bar_lbl = label_constructor(str(value))
        if color is None:
            bar_lbl.set_color(bar.get_fill_color())
        else:
            bar_lbl.set_color(color)
        bar_lbl.font_size = font_size
        pos = UP if value >= 0 else DOWN
        bar_lbl.next_to(bar, pos, buff=buff)
        bar_labels.add(bar_lbl)
    return bar_labels

change_bar_values

代码
import manimgx as m


class BarChartChangeBarValuesExample(m.Scene):
    def construct(self) -> None:
        chart = m.BarChart(
            values=[4, 8, 2, 6], y_range=[-4, 8, 2], x_length=9, y_length=6
        )
        self.add(chart)
        self.play(chart.animate.change_bar_values([7, -3, 5, 1]))

改变条的值:每个条从 x 轴拉伸到其新高度,若值变号则跨到另一侧。

y 轴保持不变,之前制作的标签不跟随;要为变化制作动画,用 .animate。

bar_chart.change_bar_values(values, update_colors=True)
values

新值,从左到右;少于条数则仅改变前几个。

update_colors

是否再次沿图表的渐变为条着色(从值为 0 重建的条需要它)。

源码

manimgx\mobjects\plotting.py
def change_bar_values(
    self, values: Iterable[float], update_colors: bool = True
) -> Self:
    """改变条的值:每个条从 x 轴拉伸到其新高度,若值变号则跨到另一侧。

    y 轴保持不变,之前制作的标签不跟随;要为变化制作动画,用 `.animate`。

    Args:
        values: 新值,从左到右;少于条数则仅改变前几个。
        update_colors: 是否再次沿图表的渐变为条着色(从值为 0 重建的条需要它)。

    Examples:
        ```python
        import manimgx as m


        class BarChartChangeBarValuesExample(m.Scene):
            def construct(self) -> None:
                chart = m.BarChart(
                    values=[4, 8, 2, 6], y_range=[-4, 8, 2], x_length=9, y_length=6
                )
                self.add(chart)
                self.play(chart.animate.change_bar_values([7, -3, 5, 1]))
        ```
    """
    values = list(values)
    # the bars as they are: a bar remade below takes its place in `self.bars`
    for i, (bar, value) in enumerate(zip(list(self.bars), values, strict=False)):
        chart_val = self.values[i]
        if chart_val == 0:  # a bar of no height has no side to grow from: remade
            self.bars.remove(bar)
            self.bars.insert(i, self._create_bar(i, value))
            continue
        bar_lim, aligned_edge = (
            (bar.get_bottom(), DOWN) if chart_val > 0 else (bar.get_top(), UP)
        )
        quotient = value / chart_val
        if quotient < 0:
            aligned_edge = UP if chart_val > 0 else DOWN
        bar.stretch_to_fit_height(abs(quotient) * bar.height)
        bar.move_to(bar_lim, aligned_edge)
    if update_colors:
        self._update_colors()
    self.values[: len(values)] = values
    return self

SampleSpace

SampleSpaceExample
代码
import manimgx as m


class SampleSpaceExample(m.Scene):
    def construct(self) -> None:
        space = m.SampleSpace(width=6, height=5)
        space.divide_vertically(0.4, colors=[m.BLUE_E, m.GREY_BROWN])
        rain, dry = space.vertical_parts
        colors = [m.RED_E, m.TEAL_E]
        rain.add(rain.get_division_along_dimension(0.7, 1, colors, m.DOWN))
        dry.add(dry.get_division_along_dimension(0.2, 1, colors, m.DOWN))
        rain_label = m.Text("rain").next_to(rain, m.DOWN)
        dry_label = m.Text("dry").next_to(dry, m.DOWN)
        self.add(space, rain_label, dry_label)

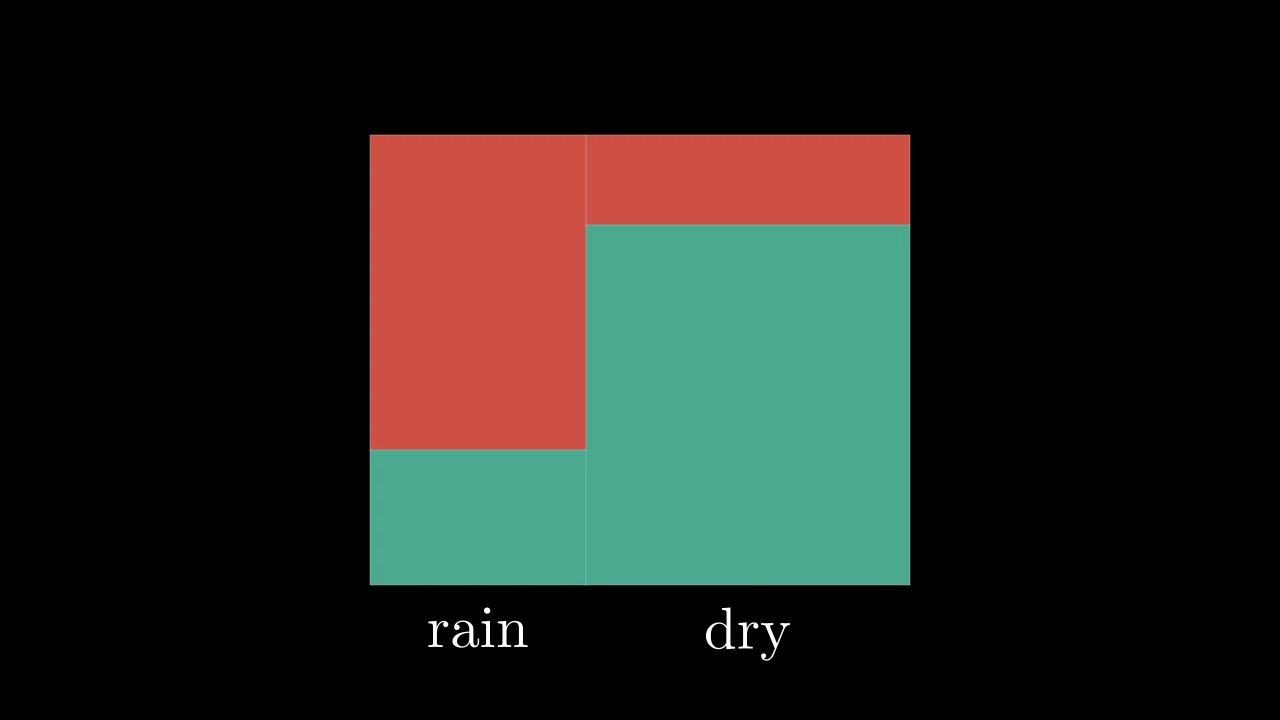
样本空间:一个代表所有结果的矩形,分为面积即概率的部分;未设置样式时为深灰色、填充、带细浅灰色轮廓。

divide_vertically 将其分为垂直条,每个概率一个,从左到右,并保留为其 vertical_parts; get_division_along_dimension 制作沿任一侧、在任一方向上的划分的部分。每个部分本身是一个样本空间,可以继续划分。

m.SampleSpace(height=3, width=3, default_label_scale_val=1, **kwargs)
height

其高度,以场景单位计。

width

其宽度,以场景单位计。

default_label_scale_val

为 Manim 兼容性而接受;被忽略。

color

填充与描边共用的颜色(默认白色);None 表示该类的默认值。

fill_color

填充的颜色;未给出时为 color。多个颜色沿 sheen_direction 构成渐变。

fill_opacity

填充的不透明度,取值从 0 到 1(默认 0:无填充)。

stroke_color

描边的颜色;未给出时为 color。多个颜色构成渐变。

stroke_opacity

描边的不透明度,取值从 0 到 1(默认 1)。

stroke_width

描边的宽度,以场景单位的百分之一计(默认 4;0:无描边)。

background_stroke_color

绘制于填充之后的轮廓颜色(默认黑色)。

background_stroke_opacity

轮廓的不透明度,取值从 0 到 1(默认 1)。

background_stroke_width

轮廓的宽度,以场景单位的百分之一计(默认 0:无)。

sheen_factor

颜色朝 sheen_direction 变亮的程度,取值从 -1 到 1(默认 0); 负值变暗。

sheen_direction

颜色变亮的方向(默认 UL)。

joint_type

描边在路径转折处的连接方式:圆角、斜切或斜接,按二维场景的绘制方式 (参见 LineJointType;默认 AUTO:斜接)。

cap_style

描边在其显示的每一端的端点样式(开放路径的端点、虚线的端点):圆头、平头 或方头,按二维场景的绘制方式(参见 CapStyleType;默认 AUTO:平头)。

shade_in_3d

三维场景的光是否对该 mobject 着色。

material

其表面在三维场景中如何反射场景的光(参见 Material);None:Manim 的着色(默认)。

name

mobject 的名称;未给出时为其类名。

z_index

其在绘制顺序中的位置:索引较高者绘制于较低者之上 (默认 0)。

target

MoveToTarget 将 mobject 移动至的状态。

还接受 样式关键字。

源码

manimgx\mobjects\plotting.py

def __init__(
    self,
    height: float = 3,
    width: float = 3,
    default_label_scale_val: float = 1,
    **kwargs: Unpack[Style],
):
    super().__init__(height=height, width=width, **kwargs)
    self.default_label_scale_val = default_label_scale_val

get_division_along_dimension

制作沿某维度划分样本空间的部分,每个概率一个,每个为其那个分数。

部分在 vect 方向上一个接一个,从空间与之相对的边起;它们沿 colors 的渐变着色,每个本身是一个样本空间。

sample_space.get_division_along_dimension(p_list, dim, colors, vect)
p_list

概率:若其和小于 1,为余数添加一个部分。

dim

被划分的维度:0 为宽度,1 为高度。

colors

颜色,部分上的渐变。

vect

部分一个接一个的方向。

返回 部分的新组,未添加到空间。

源码

manimgx\mobjects\plotting.py
def get_division_along_dimension(
    self,
    p_list: float | Iterable[float],
    dim: int,
    colors: Sequence[ParsableManimColor],
    vect: Vector3D,
) -> VGroup:
    """制作沿某维度划分样本空间的部分,每个概率一个,每个为其那个分数。

    部分在 `vect` 方向上一个接一个,从空间与之相对的边起;它们沿 `colors` 的渐变着色,每个本身是一个样本空间。

    Args:
        p_list: 概率:若其和小于 1,为余数添加一个部分。
        dim: 被划分的维度:0 为宽度,1 为高度。
        colors: 颜色,部分上的渐变。
        vect: 部分一个接一个的方向。

    Returns:
        部分的新组,未添加到空间。
    """
    p_list_complete = self.complete_p_list(p_list)
    last_point = self.get_critical_point(-vect)
    parts = VGroup()
    for factor, color in zip(
        p_list_complete, color_gradient(colors, len(p_list_complete)), strict=True
    ):
        part = SampleSpace()
        part.set_fill(color, 1)
        part.replace(self, stretch=True)
        part.stretch(factor, dim)
        part.move_to(last_point, -vect)
        last_point = part.get_critical_point(vect)
        parts.add(part)
    return parts

get_vertical_division

制作划分样本空间的垂直条,每个概率一个,从左到右(参见 get_division_along_dimension)。

sample_space.get_vertical_division(p_list, colors=(MAROON_B, YELLOW), vect=RIGHT)
p_list

概率,补全至和为 1。

colors

颜色,条上的渐变。

vect

条一个接一个的方向:RIGHT,从左起。

返回 条的新组,未添加到空间。

源码

manimgx\mobjects\plotting.py

def get_vertical_division(
    self,
    p_list: float | Iterable[float],
    colors: Sequence[ParsableManimColor] = (MAROON_B, YELLOW),
    vect: Vector3D = RIGHT,
) -> VGroup:
    """制作划分样本空间的垂直条,每个概率一个,从左到右(参见 [get_division_along_dimension][manimgx.SampleSpace.get_division_along_dimension])。

    Args:
        p_list: 概率,补全至和为 1。
        colors: 颜色,条上的渐变。
        vect: 条一个接一个的方向:RIGHT,从左起。

    Returns:
        条的新组,未添加到空间。
    """
    return self.get_division_along_dimension(p_list, 0, colors, vect)

divide_vertically

SampleSpaceDivideVerticallyExample
代码
import manimgx as m


class SampleSpaceDivideVerticallyExample(m.Scene):
    def construct(self) -> None:
        space = m.SampleSpace(width=9, height=4)
        space.divide_vertically([0.25, 0.25], colors=[m.RED_E, m.GOLD_E])
        parts = space.vertical_parts
        labels = [m.Text(n).move_to(p) for n, p in zip("ABC", parts)]
        self.add(space, *labels)

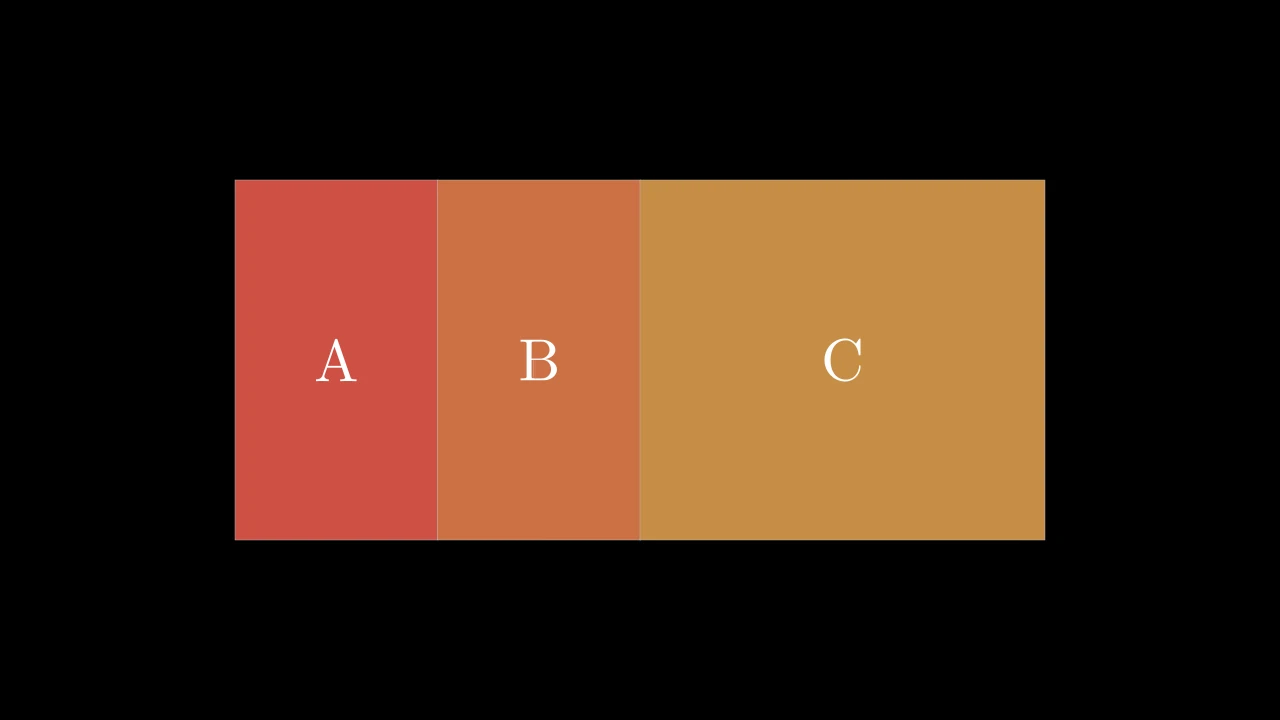
将样本空间分为垂直条,每个概率一个,从左到右:每个为其宽度的那个分数。

概率补全至和为 1。条添加到空间,作为一个组,并保留为其 vertical_parts。

sample_space.divide_vertically(p_list, colors=(MAROON_B, YELLOW), vect=RIGHT)
p_list

一个概率,或多个概率。

colors

条的颜色:其上的渐变。

vect

条一个接一个的方向:RIGHT,从左起。

源码

manimgx\mobjects\plotting.py

def divide_vertically(
    self,
    p_list: float | Iterable[float],
    colors: Sequence[ParsableManimColor] = (MAROON_B, YELLOW),
    vect: Vector3D = RIGHT,
) -> Self:
    """将样本空间分为垂直条,每个概率一个,从左到右:每个为其宽度的那个分数。

    概率补全至和为 1。条添加到空间,作为一个组,并保留为其 `vertical_parts`。

    Args:
        p_list: 一个概率,或多个概率。
        colors: 条的颜色:其上的渐变。
        vect: 条一个接一个的方向:RIGHT,从左起。

    Examples:
        ```python
        import manimgx as m


        class SampleSpaceDivideVerticallyExample(m.Scene):
            def construct(self) -> None:
                space = m.SampleSpace(width=9, height=4)
                space.divide_vertically([0.25, 0.25], colors=[m.RED_E, m.GOLD_E])
                parts = space.vertical_parts
                labels = [m.Text(n).move_to(p) for n, p in zip("ABC", parts)]
                self.add(space, *labels)
        ```
    """
    self.vertical_parts = self.get_vertical_division(p_list, colors, vect)
    self.add(self.vertical_parts)
    return self

AxesOptions

Axes 除范围和长度外的关键字,用于传递它们的类(ThreeDAxes、平面、BarChart):其坐标轴的配置和箭头,附带样式关键字。

axis_config

每个坐标轴的 数轴关键字:include_numbers、font_size、color、…(默认 None:无)。

x_axis_config

x 轴的数轴关键字,覆盖 axis_config 的(默认 None:无)。

y_axis_config

y 轴的数轴关键字,覆盖 axis_config 的(默认 None:无)。

tips

每个坐标轴末端是否有箭头(默认 True;平面的坐标轴无箭头,除非 axis_config 包含 include_tip)。

color

填充与描边共用的颜色(默认白色);None 表示该类的默认值。

fill_color

填充的颜色;未给出时为 color。多个颜色沿 sheen_direction 构成渐变。

fill_opacity

填充的不透明度,取值从 0 到 1(默认 0:无填充)。

stroke_color

描边的颜色;未给出时为 color。多个颜色构成渐变。

stroke_opacity

描边的不透明度,取值从 0 到 1(默认 1)。

stroke_width

描边的宽度,以场景单位的百分之一计(默认 4;0:无描边)。

background_stroke_color

绘制于填充之后的轮廓颜色(默认黑色)。

background_stroke_opacity

轮廓的不透明度,取值从 0 到 1(默认 1)。

background_stroke_width

轮廓的宽度,以场景单位的百分之一计(默认 0:无)。

sheen_factor

颜色朝 sheen_direction 变亮的程度,取值从 -1 到 1(默认 0); 负值变暗。

sheen_direction

颜色变亮的方向(默认 UL)。

joint_type

描边在路径转折处的连接方式:圆角、斜切或斜接,按二维场景的绘制方式 (参见 LineJointType;默认 AUTO:斜接)。

cap_style

描边在其显示的每一端的端点样式(开放路径的端点、虚线的端点):圆头、平头 或方头,按二维场景的绘制方式(参见 CapStyleType;默认 AUTO:平头)。

shade_in_3d

三维场景的光是否对该 mobject 着色。

material

其表面在三维场景中如何反射场景的光(参见 Material);None:Manim 的着色(默认)。

name

mobject 的名称;未给出时为其类名。

z_index

其在绘制顺序中的位置:索引较高者绘制于较低者之上 (默认 0)。

target

MoveToTarget 将 mobject 移动至的状态。