曲线
影片代码
import manimgx as m
import numpy as np


def heart(t: float) -> np.ndarray:
    x = 16 * np.sin(t) ** 3
    y = 13 * np.cos(t) - 5 * np.cos(2 * t) - 2 * np.cos(3 * t) - np.cos(4 * t)
    return np.array([x, y, 0]) / 6


class CurvesHero(m.Scene):
    def construct(self) -> None:
        graph = m.FunctionGraph(np.sin, x_range=[-6, -1], color=m.BLUE)
        curve = m.ParametricFunction(heart, t_range=[0, 2 * np.pi], color=m.RED)
        circle = m.ImplicitFunction(
            lambda x, y: (x - 4) ** 2 + y**2 - 2.25, color=m.YELLOW
        )
        self.play(m.Create(graph), m.Create(curve), m.Create(circle), run_time=3)
        self.wait()
这些曲线绘制在帧自身的坐标系中:sin 的图像经过帧的 [0, 0, 0] 点。若要在坐标轴上以其坐标系绘制图像,请使用 axes.plot,它会为你创建其中之一。
代码
import numpy as np

import manimgx as m


class FunctionGraphExample(m.Scene):
    def construct(self) -> None:
        wave = m.FunctionGraph(
            lambda x: np.sin(x) + 0.5 * np.sin(7 * x) + np.sin(14 * x) / 7,
            color=m.BLUE,
        )
        bell = m.FunctionGraph(
            lambda x: 3 * np.exp(-(x**2)), x_range=[-4, 4], color=m.YELLOW
        )
        self.play(m.Create(wave), m.Create(bell), run_time=2)
函数 y = f(x) 的图像,在场景坐标系中:点 (x, f(x), 0),平滑连接;未设置样式时为亮黄色(PURE_YELLOW)。
采样器可能用数组和单个值调用该函数,并在需要时回退到标量求值。回调调用的次数不予保证。
要在坐标轴上以坐标轴坐标系绘制函数图像,请参见 plot。
function函数,从 x 到 y。
x_rangex 的范围,
[x_min, x_max]或[x_min, x_max, x_step];未给出步长时为 0.01。None 表示画框的宽度。color填充与描边共用的颜色(默认白色);None 表示该类的默认值。
fill_color填充的颜色;未给出时为
color。多个颜色沿sheen_direction构成渐变。fill_opacity填充的不透明度,取值从 0 到 1(默认 0:无填充)。
stroke_color描边的颜色;未给出时为
color。多个颜色构成渐变。stroke_opacity描边的不透明度,取值从 0 到 1(默认 1)。
stroke_width描边的宽度,以场景单位的百分之一计(默认 4;0:无描边)。
background_stroke_color绘制于填充之后的轮廓颜色(默认黑色)。
background_stroke_opacity轮廓的不透明度,取值从 0 到 1(默认 1)。
background_stroke_width轮廓的宽度,以场景单位的百分之一计(默认 0:无)。
sheen_factor颜色朝
sheen_direction变亮的程度,取值从 -1 到 1(默认 0); 负值变暗。sheen_direction颜色变亮的方向(默认
UL)。joint_type描边在路径转折处的连接方式:圆角、斜切或斜接,按二维场景的绘制方式 (参见 LineJointType;默认 AUTO:斜接)。
cap_style描边在其显示的每一端的端点样式(开放路径的端点、虚线的端点):圆头、平头 或方头,按二维场景的绘制方式(参见 CapStyleType;默认 AUTO:平头)。
shade_in_3d三维场景的光是否对该 mobject 着色。
material其表面在三维场景中如何反射场景的光(参见 Material);None:Manim 的着色(默认)。
namemobject 的名称;未给出时为其类名。
z_index其在绘制顺序中的位置:索引较高者绘制于较低者之上 (默认 0)。
targetMoveToTarget将 mobject 移动至的状态。
还接受 样式关键字。
源码
manimgx\mobjects\plotting.py
代码
import numpy as np

import manimgx as m


class ParametricFunctionExample(m.Scene):
    def construct(self) -> None:
        lissajous = m.ParametricFunction(
            lambda t: np.array([2.5 * np.sin(2 * t), 2.5 * np.sin(3 * t), 0]),
            t_range=[0, m.TAU],
            color=m.BLUE,
        )
        spiral = m.ParametricFunction(
            lambda t: np.array([0.15 * t * np.cos(t), 0.15 * t * np.sin(t), 0]),
            t_range=[0, 3 * m.TAU],
            color=m.YELLOW,
        )
        curves = m.VGroup(lissajous, spiral).arrange(buff=1.5)
        self.play(m.Create(curves), run_time=3)
参数曲线:t 从 t_min 到 t_max 的点 function(t),平滑连接;未设置样式时为白色。
函数每 t_step 采样一次,并在 t_max 处采样,采样点通过过它们的平滑曲线连接(或不使用 use_smoothing 时用直线段连接)。在函数跳跃处,给出其 discontinuities:曲线在这些值之间分段绘制,每段在距不连续点 dt 处停止。除非 use_vectorized,函数首先会尝试一次性接收所有 t 值(作为数组),并与单次调用进行对照检查;不接受数组的函数则每个值调用一次。
不连续点保留为曲线创建时的列表(在范围过滤之前),因此副本和重新生成的曲线保留其所有断点。
要在坐标轴上以坐标轴坐标系绘制函数图像,请参见 plot。
function函数,从 t 到场景坐标系中的一个点:其 x、y 和 z。
t_ranget 的范围,
[t_min, t_max]或[t_min, t_max, t_step];未给出步长时为 0.01。scalingt 在其范围内如何分布:均匀分布,使用 LinearBase;使用 LogBase 时, 范围为指数,t 在幂上运行。
dt每处不连续点前各段停止的距离,以 t 为单位。
discontinuities曲线断开的 t 值;None 表示无。
use_smoothing采样点是否通过过它们的平滑曲线连接,而非用直线段连接。
use_vectorizedfunction是否一次性接收所有 t 值(作为数组),并返回 x、y 和 z 的数组(非数组的 z 被视为 0)。color填充与描边共用的颜色(默认白色);None 表示该类的默认值。
fill_color填充的颜色;未给出时为
color。多个颜色沿sheen_direction构成渐变。fill_opacity填充的不透明度,取值从 0 到 1(默认 0:无填充)。
stroke_color描边的颜色;未给出时为
color。多个颜色构成渐变。stroke_opacity描边的不透明度,取值从 0 到 1(默认 1)。
stroke_width描边的宽度,以场景单位的百分之一计(默认 4;0:无描边)。
background_stroke_color绘制于填充之后的轮廓颜色(默认黑色)。
background_stroke_opacity轮廓的不透明度,取值从 0 到 1(默认 1)。
background_stroke_width轮廓的宽度,以场景单位的百分之一计(默认 0:无)。
sheen_factor颜色朝
sheen_direction变亮的程度,取值从 -1 到 1(默认 0); 负值变暗。sheen_direction颜色变亮的方向(默认
UL)。joint_type描边在路径转折处的连接方式:圆角、斜切或斜接,按二维场景的绘制方式 (参见 LineJointType;默认 AUTO:斜接)。
cap_style描边在其显示的每一端的端点样式(开放路径的端点、虚线的端点):圆头、平头 或方头,按二维场景的绘制方式(参见 CapStyleType;默认 AUTO:平头)。
shade_in_3d三维场景的光是否对该 mobject 着色。
material其表面在三维场景中如何反射场景的光(参见 Material);None:Manim 的着色(默认)。
namemobject 的名称;未给出时为其类名。
z_index其在绘制顺序中的位置:索引较高者绘制于较低者之上 (默认 0)。
targetMoveToTarget将 mobject 移动至的状态。
还接受 样式关键字。
源码
manimgx\mobjects\plotting.py
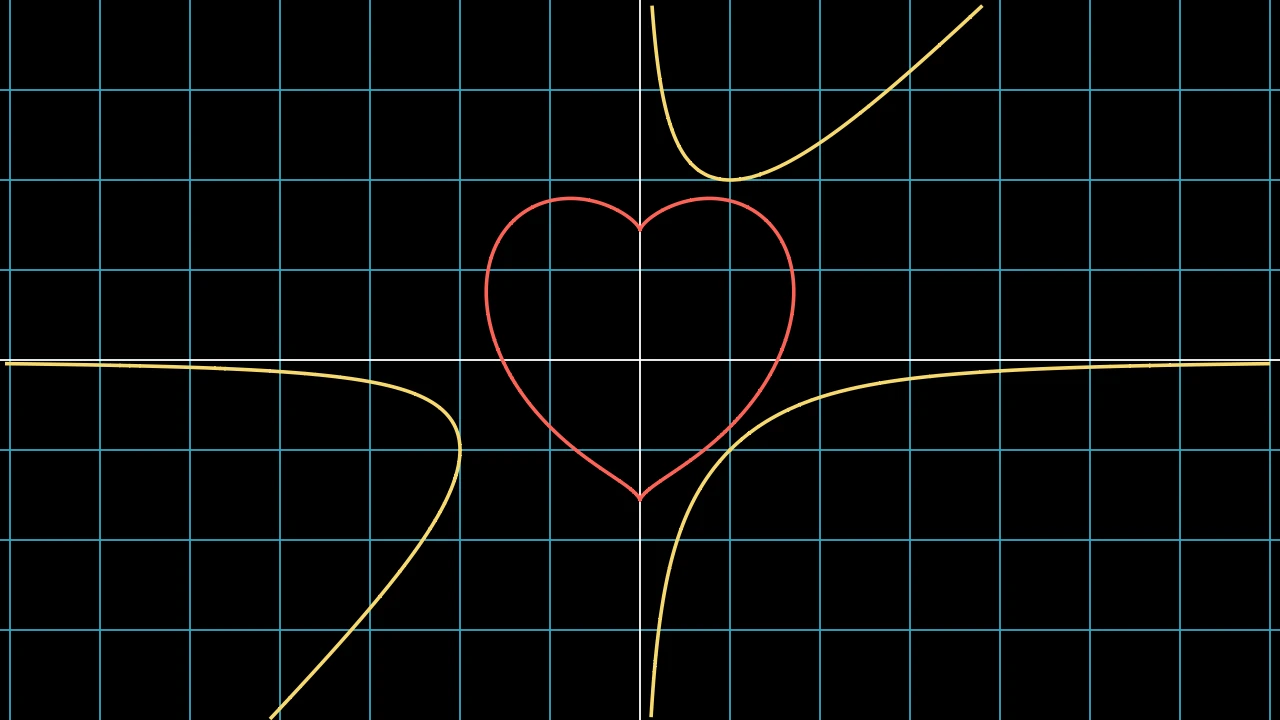
代码
import manimgx as m


class ImplicitFunctionExample(m.Scene):
    def construct(self) -> None:
        cubic = m.ImplicitFunction(
            lambda x, y: x * y**2 - x**2 * y - 2, color=m.YELLOW
        )
        heart = m.ImplicitFunction(
            lambda x, y: (x**2 + y**2 - 1) ** 3 - x**2 * y**3,
            x_range=[-1.5, 1.5],
            y_range=[-1.5, 1.5],
            color=m.RED,
        ).scale(1.5)
        self.add(m.NumberPlane(), cubic, heart)
x 和 y 的函数为零的曲线,即 func(x, y) = 0,在场景坐标系中,在矩形内寻找;未设置样式时为白色。
矩形被四等分,每一部分再四等分,在曲线经过处更精细,曲线通过单元格被追踪:其每一段对应一条路径。要在坐标轴上以坐标轴坐标系绘制,请参见 plot_implicit_curve。
funcx 和 y 的函数,在场景坐标系中。
x_range要查找的 x 的范围,
[x_min, x_max];None 表示画框的宽度。y_range要查找的 y 的范围,
[y_min, y_max];None 表示画框的高度。min_depth矩形至少被四等分的次数:更多次能找到曲线更小的段。
max_quads矩形最多可划分的单元格数:更多能更紧密地跟随曲线,但耗时更长。
use_smoothing曲线是否通过其点平滑连接,而非用直线段绘制。
color填充与描边共用的颜色(默认白色);None 表示该类的默认值。
fill_color填充的颜色;未给出时为
color。多个颜色沿sheen_direction构成渐变。fill_opacity填充的不透明度,取值从 0 到 1(默认 0:无填充)。
stroke_color描边的颜色;未给出时为
color。多个颜色构成渐变。stroke_opacity描边的不透明度,取值从 0 到 1(默认 1)。
stroke_width描边的宽度,以场景单位的百分之一计(默认 4;0:无描边)。
background_stroke_color绘制于填充之后的轮廓颜色(默认黑色)。
background_stroke_opacity轮廓的不透明度,取值从 0 到 1(默认 1)。
background_stroke_width轮廓的宽度,以场景单位的百分之一计(默认 0:无)。
sheen_factor颜色朝
sheen_direction变亮的程度,取值从 -1 到 1(默认 0); 负值变暗。sheen_direction颜色变亮的方向(默认
UL)。joint_type描边在路径转折处的连接方式:圆角、斜切或斜接,按二维场景的绘制方式 (参见 LineJointType;默认 AUTO:斜接)。
cap_style描边在其显示的每一端的端点样式(开放路径的端点、虚线的端点):圆头、平头 或方头,按二维场景的绘制方式(参见 CapStyleType;默认 AUTO:平头)。
shade_in_3d三维场景的光是否对该 mobject 着色。
material其表面在三维场景中如何反射场景的光(参见 Material);None:Manim 的着色(默认)。
namemobject 的名称;未给出时为其类名。
z_index其在绘制顺序中的位置:索引较高者绘制于较低者之上 (默认 0)。
targetMoveToTarget将 mobject 移动至的状态。
还接受 样式关键字。
源码
manimgx\mobjects\plotting.py
曲线为其零点的函数。