跳转至

坐标轴

影片代码
import manimgx as m


class AxesHero(m.Scene):
    def construct(self) -> None:
        axes = m.Axes(x_range=[-1, 5, 1], y_range=[-1, 4, 1], x_length=9, y_length=6)
        axes.add_coordinates()
        names = axes.get_axis_labels("x", "y")
        point = axes.c2p(3, 2)
        dot = m.Dot(point, color=m.YELLOW)
        lines = axes.get_lines_to_point(point, color=m.YELLOW)
        label = m.MathTex("(3, 2)", color=m.YELLOW).next_to(dot, m.UR, buff=0.15)
        self.play(m.Create(axes), m.Write(names))
        self.play(m.GrowFromCenter(dot), m.Create(lines), m.Write(label))
        self.wait()

坐标轴的每根轴都有一个范围 [start, end, step] 和一个以帧为单位的长度:x_range=[-3, 3, 1] 将 x 轴从 −3 编号到 3,每个单位处有一个刻度;x_length=8 使其长度为 8 个单位。坐标轴的坐标系是其自身的:x 为 2、y 为 4 的点是 axes.c2p(2, 4),无论坐标轴位于何处、有多长。

Axes

代码
import manimgx as m


class AxesExample(m.Scene):
    def construct(self) -> None:
        axes = m.Axes(
            x_range=[0, 10, 1],
            y_range=[-2, 6, 2],
            x_length=10,
            y_length=6,
            axis_config={"include_numbers": True, "font_size": 28},
        )
        labels = axes.get_axis_labels("t", "v")
        graph = axes.plot(lambda t: 5 - 0.2 * (t - 4) ** 2, color=m.BLUE)
        self.add(axes, labels)
        self.play(m.Create(graph))

坐标轴:过同一原点的数轴,有自己的坐标,以及在其上绘图的工具;未配置时为白色,带箭头。

坐标轴选项映射是构造输入。完成的数轴保留其自身的默认值,用于后续的刻度、标签和坐标。

x 轴在 x_range 上运行,y 轴在 y_range 上运行,每个都是 NumberLine,在其范围的每一步处有刻度。坐标轴在其 0 处交叉(或对于不含 0 的范围,在其最接近 0 的端点处),且两个范围中点对应的点放在场景原点。线性坐标轴上 0 处的刻度被省略,因为另一坐标轴在此处穿过;数字写在刻度处但不含 0(参见 add_coordinates)。

coords_to_point(c2p,或 axes @ (x, y))和 point_to_coords(p2c)在坐标轴的坐标与场景的点之间转换。plot 方法在坐标轴上以其坐标绘图:函数的图像、隐式给出的曲线或极坐标曲线、折线图。get_ 方法制作解释图像的内容:其标签、其下方的面积、黎曼矩形、割线、到点的线。它们都返回新的 mobject,未添加到坐标轴。

m.Axes(x_range=None, y_range=None, x_length=None, y_length=None, axis_config=None, x_axis_config=None, y_axis_config=None, tips=True, **kwargs)
x_range

x 轴的范围,[x_min, x_max, x_step],或 [x_min, x_max] 表示步长为 1;None 表示画框的宽度,[-7, 7, 1]。

y_range

y 轴的范围,同上;None 表示画框的高度,[-4, 4, 1]。

x_length

x 轴的长度,以场景单位计;None 表示画框宽度减 2,取整,即坐标轴创建时画框的尺寸(宽视频中为 12,高视频中为 6),或坐标轴配置给出时每单位 unit_size。

y_length

y 轴的长度,以场景单位计;None 表示画框高度减 2,取整(宽视频中为 6,高视频中为 12),或坐标轴配置给出时每单位 unit_size。

axis_config

两个坐标轴的 数轴关键字:include_numbers、font_size、color、…;None 表示无。

x_axis_config

x 轴的数轴关键字,覆盖 axis_config 的;None 表示无。

y_axis_config

y 轴的数轴关键字,覆盖 axis_config 的;None 表示无。

tips

每个坐标轴末端是否有箭头。

color

填充与描边共用的颜色(默认白色);None 表示该类的默认值。

fill_color

填充的颜色;未给出时为 color。多个颜色沿 sheen_direction 构成渐变。

fill_opacity

填充的不透明度,取值从 0 到 1(默认 0:无填充)。

stroke_color

描边的颜色;未给出时为 color。多个颜色构成渐变。

stroke_opacity

描边的不透明度,取值从 0 到 1(默认 1)。

stroke_width

描边的宽度,以场景单位的百分之一计(默认 4;0:无描边)。

background_stroke_color

绘制于填充之后的轮廓颜色(默认黑色)。

background_stroke_opacity

轮廓的不透明度,取值从 0 到 1(默认 1)。

background_stroke_width

轮廓的宽度,以场景单位的百分之一计(默认 0:无)。

sheen_factor

颜色朝 sheen_direction 变亮的程度,取值从 -1 到 1(默认 0); 负值变暗。

sheen_direction

颜色变亮的方向(默认 UL)。

joint_type

描边在路径转折处的连接方式:圆角、斜切或斜接,按二维场景的绘制方式 (参见 LineJointType;默认 AUTO:斜接)。

cap_style

描边在其显示的每一端的端点样式(开放路径的端点、虚线的端点):圆头、平头 或方头,按二维场景的绘制方式(参见 CapStyleType;默认 AUTO:平头)。

shade_in_3d

三维场景的光是否对该 mobject 着色。

material

其表面在三维场景中如何反射场景的光(参见 Material);None:Manim 的着色(默认)。

name

mobject 的名称;未给出时为其类名。

z_index

其在绘制顺序中的位置:索引较高者绘制于较低者之上 (默认 0)。

target

MoveToTarget 将 mobject 移动至的状态。

还接受 样式关键字。

源码

manimgx\mobjects\plotting.py

def __init__(
    self,
    x_range: Sequence[float] | None = None,
    y_range: Sequence[float] | None = None,
    x_length: float | None = None,
    y_length: float | None = None,
    axis_config: NumberLineOptions | None = None,
    x_axis_config: NumberLineOptions | None = None,
    y_axis_config: NumberLineOptions | None = None,
    tips: bool = True,
    **kwargs: Unpack[Style],
):
    super().__init__(**kwargs)
    self.dimension = 2
    self.x_range = _full_range(x_range, config.frame_x_radius)
    """x 轴的范围,`[x_min, x_max, x_step]`。"""
    self.y_range = _full_range(y_range, config.frame_y_radius)
    """y 轴的范围,`[y_min, y_max, y_step]`。"""
    self.num_sampled_graph_points_per_tick = 10
    """未给出步长时 [plot][manimgx.Axes.plot] 在 x 轴的每一步中对函数采样的次数(默认 10)。"""
    axis_config = merged_axis_config(
        {"include_tip": tips, "numbers_to_exclude": [0]}, axis_config
    )
    x_axis_config = _origin_tick(merged_axis_config(axis_config, x_axis_config))
    y_axis_config = _origin_tick(
        merged_axis_config(
            axis_config,
            {"rotation": 90 * DEGREES, "label_direction": LEFT},
            y_axis_config,
        )
    )
    self.x_axis = self._create_axis(self.x_range, x_axis_config, x_length, 0)
    """x 轴,一个 [NumberLine][manimgx.NumberLine]。"""
    self.y_axis = self._create_axis(self.y_range, y_axis_config, y_length, 1)
    """y 轴,一个 [NumberLine][manimgx.NumberLine]。"""
    self.x_length, self.y_length = (
        self.x_axis.get_length(),
        self.y_axis.get_length(),
    )
    self.axes = Group[NumberLine](self.x_axis, self.y_axis)
    """坐标轴,在一个组中:x 轴、y 轴(3D 中还有 z 轴)。"""
    self.add(*self.axes)
    lines_center_point = [
        axis.scaling.function((axis.x_range[1] + axis.x_range[0]) / 2)
        for axis in self.axes
    ]
    self.shift(-self.coords_to_point(*lines_center_point))

x_range

x 轴的范围,[x_min, x_max, x_step]。

y_range

y 轴的范围,[y_min, y_max, y_step]。

x_axis

x 轴,一个 NumberLine。

y_axis

y 轴,一个 NumberLine。

axes

坐标轴,在一个组中:x 轴、y 轴(3D 中还有 z 轴)。

坐标

coords_to_point

代码
import manimgx as m


class AxesCoordsToPointExample(m.Scene):
    def construct(self) -> None:
        axes = m.Axes(
            x_range=[0, 6], y_range=[0, 4], x_length=10, y_length=6
        )
        dot = m.Dot(axes.c2p(1, 1), radius=0.15, color=m.YELLOW)
        self.add(axes.add_coordinates(), dot)
        self.play(dot.animate.move_to(axes.c2p(5, 3)))
        self.play(dot.animate.move_to(axes @ (3, 0.5)))

将坐标轴上的坐标转换为场景的点,或将数组转换为点。

c2p 是其简写名,axes @ (x, y) 是其最简写名。超出坐标轴末端的坐标位于延伸的坐标轴上;缺失的坐标在坐标轴交叉处(c2p(x) 在 x 轴上)。给定每个坐标轴一个任意形状的数组(也包括网格),它一次性转换它们全部。

axes.coords_to_point(*coords)
*coords

坐标,每个坐标轴一个,按顺序:数字,或同形状的数组。

返回 点,在场景坐标系中;对于数组,为点,坐标在前(3,然后数组的形状)。

源码

manimgx\mobjects\plotting.py

def coords_to_point(self, *coords: Coordinates) -> npt.NDArray[np.float64]:
    """将坐标轴上的坐标转换为场景的点,或将数组转换为点。

    `c2p` 是其简写名,`axes @ (x, y)` 是其最简写名。超出坐标轴末端的坐标位于延伸的坐标轴上;缺失的坐标在坐标轴交叉处(`c2p(x)` 在 x 轴上)。给定每个坐标轴一个任意形状的数组(也包括网格),它一次性转换它们全部。

    Args:
        *coords: 坐标,每个坐标轴一个,按顺序:数字,或同形状的数组。

    Returns:
        点,在场景坐标系中;对于数组,为点,坐标在前(3,然后数组的形状)。

    Examples:
        ```python
        import manimgx as m


        class AxesCoordsToPointExample(m.Scene):
            def construct(self) -> None:
                axes = m.Axes(
                    x_range=[0, 6], y_range=[0, 4], x_length=10, y_length=6
                )
                dot = m.Dot(axes.c2p(1, 1), radius=0.15, color=m.YELLOW)
                self.add(axes.add_coordinates(), dot)
                self.play(dot.animate.move_to(axes.c2p(5, 3)))
                self.play(dot.animate.move_to(axes @ (3, 0.5)))
        ```
    """
    origin = self.x_axis.number_to_point(
        _origin_shift([self.x_axis.x_min, self.x_axis.x_max])
    )
    points = self.x_axis.number_to_point(np.asarray(coords[0], dtype=float))
    for axis, nums in zip(self.axes.submobjects[1:], coords[1:], strict=False):
        points = (
            points + axis.number_to_point(np.asarray(nums, dtype=float)) - origin
        )
    return points if points.ndim == 1 else np.moveaxis(points, -1, 0)

point_to_coords

将场景的点转换为其在坐标轴上的坐标,或将点转换为它们的坐标。

p2c 是其简写名。每个坐标是坐标轴在该点向其投影处的数字:对于垂直坐标轴,是 coords_to_point 的反函数。

axes.point_to_coords(point)
point

点,在场景坐标系中;或 (n, 3) 的点数组。

返回 坐标,每个坐标轴一个;对于 n 个点,为 n 行坐标的数组。

源码

manimgx\mobjects\plotting.py

def point_to_coords(
    self, point: Point3DLike | Point3DLike_Array
) -> npt.NDArray[np.float64]:
    """将场景的点转换为其在坐标轴上的坐标,或将点转换为它们的坐标。

    `p2c` 是其简写名。每个坐标是坐标轴在该点向其投影处的数字:对于垂直坐标轴,是 [coords_to_point][manimgx.Axes.coords_to_point] 的反函数。

    Args:
        point: 点,在场景坐标系中;或 (n, 3) 的点数组。

    Returns:
        坐标,每个坐标轴一个;对于 n 个点,为 n 行坐标的数组。
    """
    array = np.asarray(point, dtype=float)
    result = np.asarray([axis.point_to_number(array) for axis in self.axes])
    return result.T if array.ndim == 2 else result

polar_to_point

将坐标轴上的极坐标转换为场景的点。

pr2pt 是其简写名。该点位于坐标(radius cos azimuth、radius sin azimuth)处。

axes.polar_to_point(radius, azimuth)
radius

到原点的距离,以坐标轴的单位计。

azimuth

从正 x 轴起的角度,以弧度计,逆时针方向。

返回 点,在场景坐标系中。

源码

manimgx\mobjects\plotting.py

def polar_to_point(self, radius: float, azimuth: float) -> npt.NDArray[np.float64]:
    """将坐标轴上的极坐标转换为场景的点。

    `pr2pt` 是其简写名。该点位于坐标(`radius` cos `azimuth`、`radius` sin `azimuth`)处。

    Args:
        radius: 到原点的距离,以坐标轴的单位计。
        azimuth: 从正 x 轴起的角度,以弧度计,逆时针方向。

    Returns:
        点,在场景坐标系中。
    """
    return self.coords_to_point(radius * np.cos(azimuth), radius * np.sin(azimuth))

get_origin

坐标 (0, 0) 的点:坐标轴交叉处(若其范围包含 0)。

axes.get_origin()

返回 点,在场景坐标系中。

源码

manimgx\mobjects\plotting.py

def get_origin(self) -> Point3D:
    """坐标 (0, 0) 的点:坐标轴交叉处(若其范围包含 0)。

    Returns:
        点,在场景坐标系中。
    """
    return self.coords_to_point(0, 0)

get_x_unit_size

x 轴一个单位的长度。

axes.get_x_unit_size()

返回 长度,以场景单位计。

源码

manimgx\mobjects\plotting.py

def get_x_unit_size(self) -> float:
    """x 轴一个单位的长度。

    Returns:
        长度,以场景单位计。
    """
    return self.get_x_axis().get_unit_size()

get_y_unit_size

y 轴一个单位的长度。

axes.get_y_unit_size()

返回 长度,以场景单位计。

源码

manimgx\mobjects\plotting.py

def get_y_unit_size(self) -> float:
    """y 轴一个单位的长度。

    Returns:
        长度,以场景单位计。
    """
    return self.get_y_axis().get_unit_size()

各轴

get_x_axis

x 轴。

axes.get_x_axis()

返回 该坐标轴,一个 NumberLine。

源码

manimgx\mobjects\plotting.py

def get_x_axis(self) -> NumberLine:
    """x 轴。

    Returns:
        该坐标轴,一个 [NumberLine][manimgx.NumberLine]。
    """
    return self.get_axis(0)

get_y_axis

y 轴。

axes.get_y_axis()

返回 该坐标轴,一个 NumberLine。

源码

manimgx\mobjects\plotting.py

def get_y_axis(self) -> NumberLine:
    """y 轴。

    Returns:
        该坐标轴,一个 [NumberLine][manimgx.NumberLine]。
    """
    return self.get_axis(1)

get_z_axis

三维坐标轴的 z 轴。

axes.get_z_axis()

返回 该坐标轴,一个 NumberLine。

源码

manimgx\mobjects\plotting.py

def get_z_axis(self) -> NumberLine:
    """三维坐标轴的 z 轴。

    Returns:
        该坐标轴,一个 [NumberLine][manimgx.NumberLine]。
    """
    return self.get_axis(2)

get_axis

其中一个坐标轴。

axes.get_axis(index)
index

坐标轴的索引:0 为 x,1 为 y,2 为 z。

返回 该坐标轴,一个 NumberLine。

源码

manimgx\mobjects\plotting.py

def get_axis(self, index: int) -> NumberLine:
    """其中一个坐标轴。

    Args:
        index: 坐标轴的索引:0 为 x,1 为 y,2 为 z。

    Returns:
        该坐标轴,一个 [NumberLine][manimgx.NumberLine]。
    """
    return self.get_axes()[index]

get_axes

坐标轴:x 轴、y 轴(3D 中还有 z 轴)。

axes.get_axes()

返回 坐标轴的组,每个是一个 NumberLine。

源码

manimgx\mobjects\plotting.py

def get_axes(self) -> Group[NumberLine]:
    """坐标轴:x 轴、y 轴(3D 中还有 z 轴)。

    Returns:
        坐标轴的组,每个是一个 [NumberLine][manimgx.NumberLine]。
    """
    return self.axes

标签与数字

add_coordinates

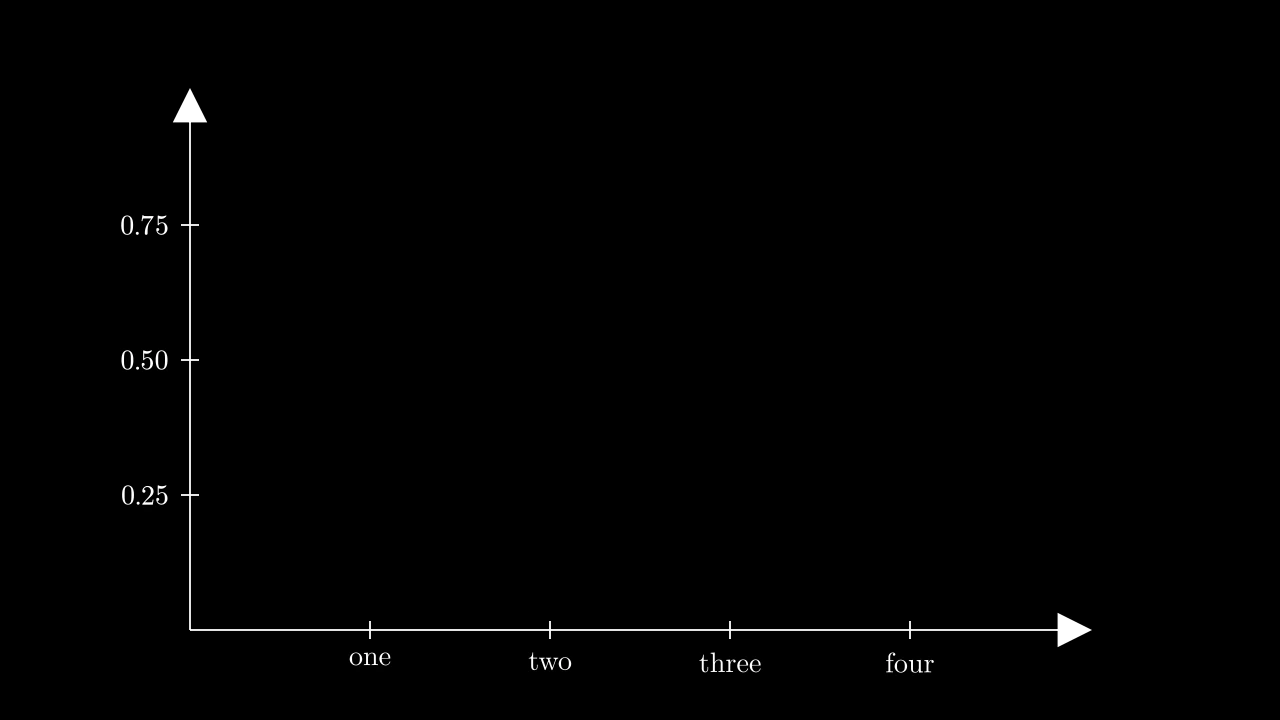
AxesAddCoordinatesExample
代码
import manimgx as m


class AxesAddCoordinatesExample(m.Scene):
    def construct(self) -> None:
        axes = m.Axes(
            x_range=[0, 5], y_range=[0, 1, 0.25], x_length=10, y_length=6
        )
        axes.add_coordinates(
            {1: "one", 2: "two", 3: "three", 4: "four"}, None, font_size=30
        )
        self.add(axes)

为坐标轴编号:在其刻度处、在给定值处,或按值给标签。

每个坐标轴给一个参数,按顺序:None 在刻度处为坐标轴编号,但不含 0(对数坐标轴上为幂:10²、10³、…);值在这些值处为坐标轴编号;从值到标签(字符串、数字或已排版的 mobject)的字典将每个标签放在其值旁(参见 add_labels)。不带参数时,每个坐标轴在其刻度处编号。数字添加到坐标轴,并保留,每个坐标轴一个组,作为坐标轴的 coordinate_labels。

axes.add_coordinates(*axes_numbers, **kwargs)
*axes_numbers

每个坐标轴上写什么,按顺序:None、值或按值的标签;最后一个参数之后的坐标轴什么也不写。

num_decimal_places

小数点后跟随的数字位数(默认为 2)。

mob_class

每个字符排版所用的类(默认为 MathTex)。

include_sign

非负数是否带加号书写(默认为 False)。

group_with_commas

小数点前的数字是否按三位一组用逗号分组,如 12,345(默认为 True)。

digit_buff_per_font_unit

字符之间的间距,按字体大小单位计:默认值 0.001 在字体大小 48 时为 0.048 个场景单位。

show_ellipsis

数字后是否跟"…",用于表示持续变化的值(默认为 False)。

unit

数字后的单位,以 LaTeX 数学表示:"^\circ" 表示度,r"\text{ m}" 表示米; 以 "^" 开头的单位会提升到数字的顶部(默认为 None)。

unit_buff_per_font_unit

单位前的间距,超出字符间距之外的部分,按字体大小单位计(默认为 0)。

include_background_rectangle

数字后是否有背景矩形(默认为 False)。

edge_to_fix

当新值改变数字宽度时保持不动的边缘,以方向表示(默认为 LEFT:向右生长)。

font_size

字符的字体大小,以 mob_class 的度量方式计(默认为 48)。

color

填充与描边共用的颜色(默认白色);None 表示该类的默认值。

fill_color

填充的颜色;未给出时为 color。多个颜色沿 sheen_direction 构成渐变。

fill_opacity

填充的不透明度,取值从 0 到 1(默认 0:无填充)。

stroke_color

描边的颜色;未给出时为 color。多个颜色构成渐变。

stroke_opacity

描边的不透明度,取值从 0 到 1(默认 1)。

stroke_width

描边的宽度,以场景单位的百分之一计(默认 4;0:无描边)。

background_stroke_color

绘制于填充之后的轮廓颜色(默认黑色)。

background_stroke_opacity

轮廓的不透明度,取值从 0 到 1(默认 1)。

background_stroke_width

轮廓的宽度,以场景单位的百分之一计(默认 0:无)。

sheen_factor

颜色朝 sheen_direction 变亮的程度,取值从 -1 到 1(默认 0); 负值变暗。

sheen_direction

颜色变亮的方向(默认 UL)。

joint_type

描边在路径转折处的连接方式:圆角、斜切或斜接,按二维场景的绘制方式 (参见 LineJointType;默认 AUTO:斜接)。

cap_style

描边在其显示的每一端的端点样式(开放路径的端点、虚线的端点):圆头、平头 或方头,按二维场景的绘制方式(参见 CapStyleType;默认 AUTO:平头)。

shade_in_3d

三维场景的光是否对该 mobject 着色。

material

其表面在三维场景中如何反射场景的光(参见 Material);None:Manim 的着色(默认)。

name

mobject 的名称;未给出时为其类名。

z_index

其在绘制顺序中的位置:索引较高者绘制于较低者之上 (默认 0)。

target

MoveToTarget 将 mobject 移动至的状态。

源码

manimgx\mobjects\plotting.py
def add_coordinates(
    self,
    *axes_numbers: Iterable[float] | Mapping[float, Label] | None,
    **kwargs: Unpack[DecimalNumberOptions],
) -> Self:
    """为坐标轴编号:在其刻度处、在给定值处,或按值给标签。

    每个坐标轴给一个参数,按顺序:None 在刻度处为坐标轴编号,但不含 0(对数坐标轴上为幂:10²、10³、…);值在这些值处为坐标轴编号;从值到标签(字符串、数字或已排版的 mobject)的字典将每个标签放在其值旁(参见 [add_labels][manimgx.NumberLine.add_labels])。不带参数时,每个坐标轴在其刻度处编号。数字添加到坐标轴,并保留,每个坐标轴一个组,作为坐标轴的 `coordinate_labels`。

    Args:
        *axes_numbers: 每个坐标轴上写什么,按顺序:None、值或按值的标签;最后一个参数之后的坐标轴什么也不写。
        **kwargs: 数字的 [数字关键字][manimgx.DecimalNumber]:`font_size`、`num_decimal_places`、`color`、…(按值的标签仅用 `font_size`)。

    Examples:
        ```python
        import manimgx as m


        class AxesAddCoordinatesExample(m.Scene):
            def construct(self) -> None:
                axes = m.Axes(
                    x_range=[0, 5], y_range=[0, 1, 0.25], x_length=10, y_length=6
                )
                axes.add_coordinates(
                    {1: "one", 2: "two", 3: "three", 4: "four"}, None, font_size=30
                )
                self.add(axes)
        ```
    """
    self.coordinate_labels = VGroup()
    for axis, values in zip(
        self.axes, axes_numbers or (None,) * self.dimension, strict=False
    ):
        if isinstance(values, Mapping):
            axis.add_labels(values, font_size=kwargs.get("font_size"))
            labels = axis.labels
        elif values is None and axis.scaling.custom_labels:
            tick_range = axis.get_tick_range()
            axis.add_labels(
                dict(
                    zip(
                        tick_range,
                        axis.scaling.get_custom_labels(tick_range),
                        strict=True,
                    )
                )
            )
            labels = axis.labels
        else:
            axis.add_numbers(values, **kwargs)
            labels = axis.numbers
        self.coordinate_labels.add(labels)
    return self

get_axis_labels

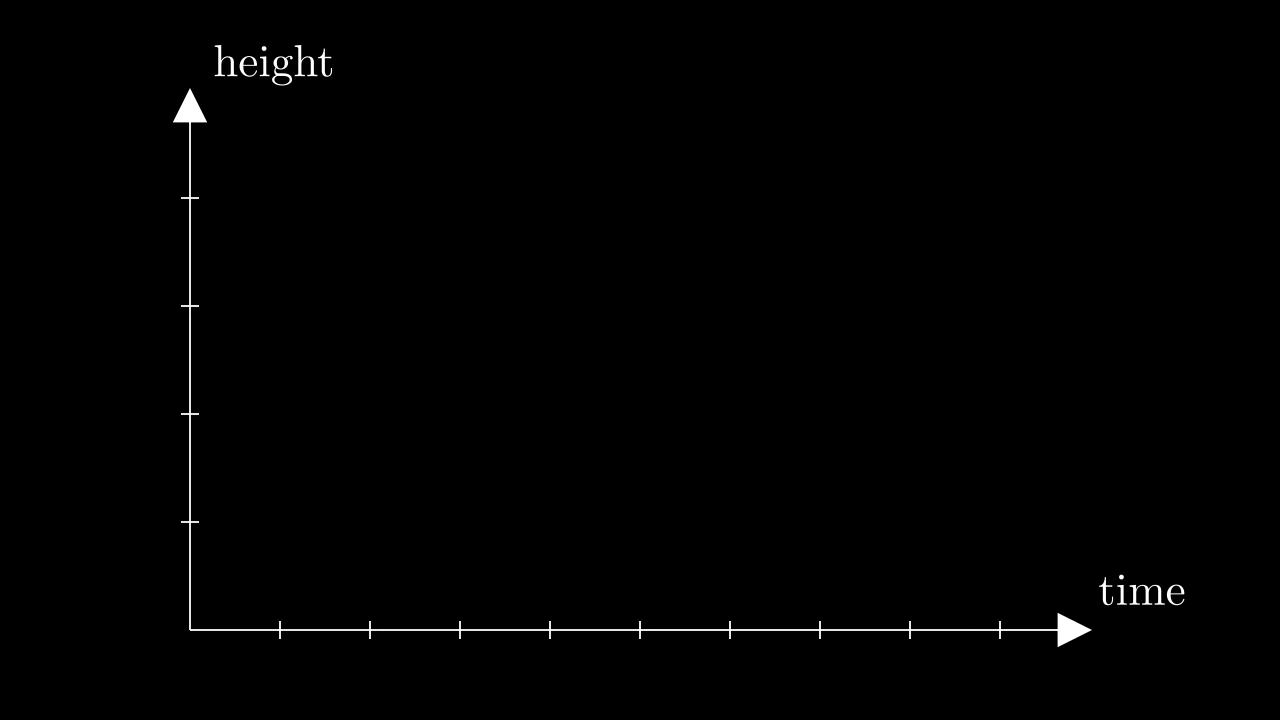
AxesGetAxisLabelsExample
代码
import manimgx as m


class AxesGetAxisLabelsExample(m.Scene):
    def construct(self) -> None:
        axes = m.Axes(x_range=[0, 10], y_range=[0, 5], x_length=10)
        labels = axes.get_axis_labels(m.Tex("time"), m.Tex("height"))
        self.add(axes, labels)

为每个坐标轴制作标签,在其末端处,按 get_x_axis_label 和 get_y_axis_label 的放置方式。

axes.get_axis_labels(x_label='x', y_label='y')
x_label

x 轴的标签:字符串或数字,按数学排版,或 mobject。

y_label

y 轴的标签,同上。

返回 标签的新组,保留为坐标轴的 axis_labels;未添加到坐标轴。

源码

manimgx\mobjects\plotting.py

def get_axis_labels(self, x_label: Label = "x", y_label: Label = "y") -> VGroup:
    """为每个坐标轴制作标签,在其末端处,按 [get_x_axis_label][manimgx.Axes.get_x_axis_label] 和 [get_y_axis_label][manimgx.Axes.get_y_axis_label] 的放置方式。

    Args:
        x_label: x 轴的标签:字符串或数字,按数学排版,或 mobject。
        y_label: y 轴的标签,同上。

    Returns:
        标签的新组,保留为坐标轴的 `axis_labels`;未添加到坐标轴。

    Examples:
        ```python
        import manimgx as m


        class AxesGetAxisLabelsExample(m.Scene):
            def construct(self) -> None:
                axes = m.Axes(x_range=[0, 10], y_range=[0, 5], x_length=10)
                labels = axes.get_axis_labels(m.Tex("time"), m.Tex("height"))
                self.add(axes, labels)
        ```
    """
    self.axis_labels = VGroup(
        self.get_x_axis_label(x_label), self.get_y_axis_label(y_label)
    )
    return self.axis_labels

get_x_axis_label

为 x 轴制作标签,在其末端处。

字符串或数字用坐标轴的 label_constructor 排版(默认按数学排版,用 MathTex);mobject 按原样使用。标签放在坐标轴的某个角旁,朝 direction 方向,然后若在屏幕外则移回屏幕上。

axes.get_x_axis_label(label, edge=UR, direction=UR, buff=SMALL_BUFF)
label

标签:字符串、数字或 mobject。

edge

标签所放的坐标轴的角,作为方向:UR,即右上角,在其末端处。

direction

标签从该角放置的方向。

buff

角与标签之间的间距,以场景单位计。

返回 标签,未添加到坐标轴。

源码

manimgx\mobjects\plotting.py

def get_x_axis_label(
    self,
    label: Label,
    edge: Vector3DLike = UR,
    direction: Vector3DLike = UR,
    buff: float = SMALL_BUFF,
) -> Mobject:
    """为 x 轴制作标签,在其末端处。

    字符串或数字用坐标轴的 `label_constructor` 排版(默认按数学排版,用 [MathTex][manimgx.MathTex]);mobject 按原样使用。标签放在坐标轴的某个角旁,朝 `direction` 方向,然后若在屏幕外则移回屏幕上。

    Args:
        label: 标签:字符串、数字或 mobject。
        edge: 标签所放的坐标轴的角,作为方向:UR,即右上角,在其末端处。
        direction: 标签从该角放置的方向。
        buff: 角与标签之间的间距,以场景单位计。

    Returns:
        标签,未添加到坐标轴。
    """
    return self._get_axis_label(
        label, self.get_x_axis(), edge, direction, buff=buff
    )

get_y_axis_label

为 y 轴制作标签,在其末端处。

字符串或数字用坐标轴的 label_constructor 排版(默认按数学排版,用 MathTex);mobject 按原样使用。标签放在坐标轴的某个角旁,朝 direction 方向,然后若在屏幕外则移回屏幕上。

axes.get_y_axis_label(label, edge=UR, direction=UP * 0.5 + RIGHT, buff=SMALL_BUFF)
label

标签:字符串、数字或 mobject。

edge

标签所放的坐标轴的角,作为方向:UR,即右上角,在其末端处。

direction

标签从该角放置的方向:默认向上向右。

buff

角与标签之间的间距,以场景单位计。

返回 标签,未添加到坐标轴。

源码

manimgx\mobjects\plotting.py

def get_y_axis_label(
    self,
    label: Label,
    edge: Vector3DLike = UR,
    direction: Vector3DLike = UP * 0.5 + RIGHT,
    buff: float = SMALL_BUFF,
) -> Mobject:
    """为 y 轴制作标签,在其末端处。

    字符串或数字用坐标轴的 `label_constructor` 排版(默认按数学排版,用 [MathTex][manimgx.MathTex]);mobject 按原样使用。标签放在坐标轴的某个角旁,朝 `direction` 方向,然后若在屏幕外则移回屏幕上。

    Args:
        label: 标签:字符串、数字或 mobject。
        edge: 标签所放的坐标轴的角,作为方向:UR,即右上角,在其末端处。
        direction: 标签从该角放置的方向:默认向上向右。
        buff: 角与标签之间的间距,以场景单位计。

    Returns:
        标签,未添加到坐标轴。
    """
    return self._get_axis_label(
        label, self.get_y_axis(), edge, direction, buff=buff
    )

到某点的连线

get_vertical_line

制作从 x 轴向上(或向下)到点的线:虚线,未设置样式时为白色细线。

axes.get_vertical_line(point, **kwargs)
point

点,在场景坐标系中。

line_func

线的类(默认 DashedLine;Line 是实线)。

line_config

线的 虚线关键字,但不包括其颜色和宽度,由 color 和 stroke_width 设置(默认 None:无)。

color

线的颜色(默认 None:白色)。

stroke_width

线的宽度,以场景单位的百分之一计(默认 2)。

返回 一条新的线,未添加到坐标轴。

源码

manimgx\mobjects\plotting.py

def get_vertical_line(self, point: Point3DLike, **kwargs: Unpack[AxisLine]) -> Line:
    """制作从 x 轴向上(或向下)到点的线:虚线,未设置样式时为白色细线。

    Args:
        point: 点,在场景坐标系中。
        **kwargs: [坐标轴线关键字][manimgx.mobjects.plotting.AxisLine]:
            线的类、关键字、`color` 和 `stroke_width`。

    Returns:
        一条新的线,未添加到坐标轴。
    """
    return self.get_line_from_axis_to_point(0, point, **kwargs)

get_horizontal_line

制作从 y 轴横跨到点的线:虚线,未设置样式时为白色细线。

axes.get_horizontal_line(point, **kwargs)
point

点,在场景坐标系中。

line_func

线的类(默认 DashedLine;Line 是实线)。

line_config

线的 虚线关键字,但不包括其颜色和宽度,由 color 和 stroke_width 设置(默认 None:无)。

color

线的颜色(默认 None:白色)。

stroke_width

线的宽度,以场景单位的百分之一计(默认 2)。

返回 一条新的线,未添加到坐标轴。

源码

manimgx\mobjects\plotting.py

def get_horizontal_line(
    self, point: Point3DLike, **kwargs: Unpack[AxisLine]
) -> Line:
    """制作从 y 轴横跨到点的线:虚线,未设置样式时为白色细线。

    Args:
        point: 点,在场景坐标系中。
        **kwargs: [坐标轴线关键字][manimgx.mobjects.plotting.AxisLine]:
            线的类、关键字、`color` 和 `stroke_width`。

    Returns:
        一条新的线,未添加到坐标轴。
    """
    return self.get_line_from_axis_to_point(1, point, **kwargs)

get_lines_to_point

代码
import manimgx as m


class AxesGetLinesToPointExample(m.Scene):
    def construct(self) -> None:
        axes = m.Axes(x_range=[0, 6], y_range=[0, 4], x_length=10)
        dot = m.Dot(axes.c2p(4, 3), radius=0.15, color=m.YELLOW)
        lines = axes.get_lines_to_point(dot.get_center(), color=m.BLUE)
        self.add(axes.add_coordinates(), dot)
        self.play(m.Create(lines))

制作从两个坐标轴到点的线:从 y 轴的 水平线,然后从 x 轴的 垂直线。

axes.get_lines_to_point(point, **kwargs)
point

点,在场景坐标系中。

line_func

线的类(默认 DashedLine;Line 是实线)。

line_config

线的 虚线关键字,但不包括其颜色和宽度,由 color 和 stroke_width 设置(默认 None:无)。

color

线的颜色(默认 None:白色)。

stroke_width

线的宽度,以场景单位的百分之一计(默认 2)。

返回 两条线的新组,未添加到坐标轴。

源码

manimgx\mobjects\plotting.py

def get_lines_to_point(
    self, point: Point3DLike, **kwargs: Unpack[AxisLine]
) -> VGroup:
    """制作从两个坐标轴到点的线:从 y 轴的 [水平线][manimgx.Axes.get_horizontal_line],然后从 x 轴的 [垂直线][manimgx.Axes.get_vertical_line]。

    Args:
        point: 点,在场景坐标系中。
        **kwargs: 两条线的 [坐标轴线关键字][manimgx.mobjects.plotting.AxisLine]。

    Returns:
        两条线的新组,未添加到坐标轴。

    Examples:
        ```python
        import manimgx as m


        class AxesGetLinesToPointExample(m.Scene):
            def construct(self) -> None:
                axes = m.Axes(x_range=[0, 6], y_range=[0, 4], x_length=10)
                dot = m.Dot(axes.c2p(4, 3), radius=0.15, color=m.YELLOW)
                lines = axes.get_lines_to_point(dot.get_center(), color=m.BLUE)
                self.add(axes.add_coordinates(), dot)
                self.play(m.Create(lines))
        ```
    """
    return VGroup(
        self.get_horizontal_line(point, **kwargs),
        self.get_vertical_line(point, **kwargs),
    )

三维坐标轴

ThreeDAxes

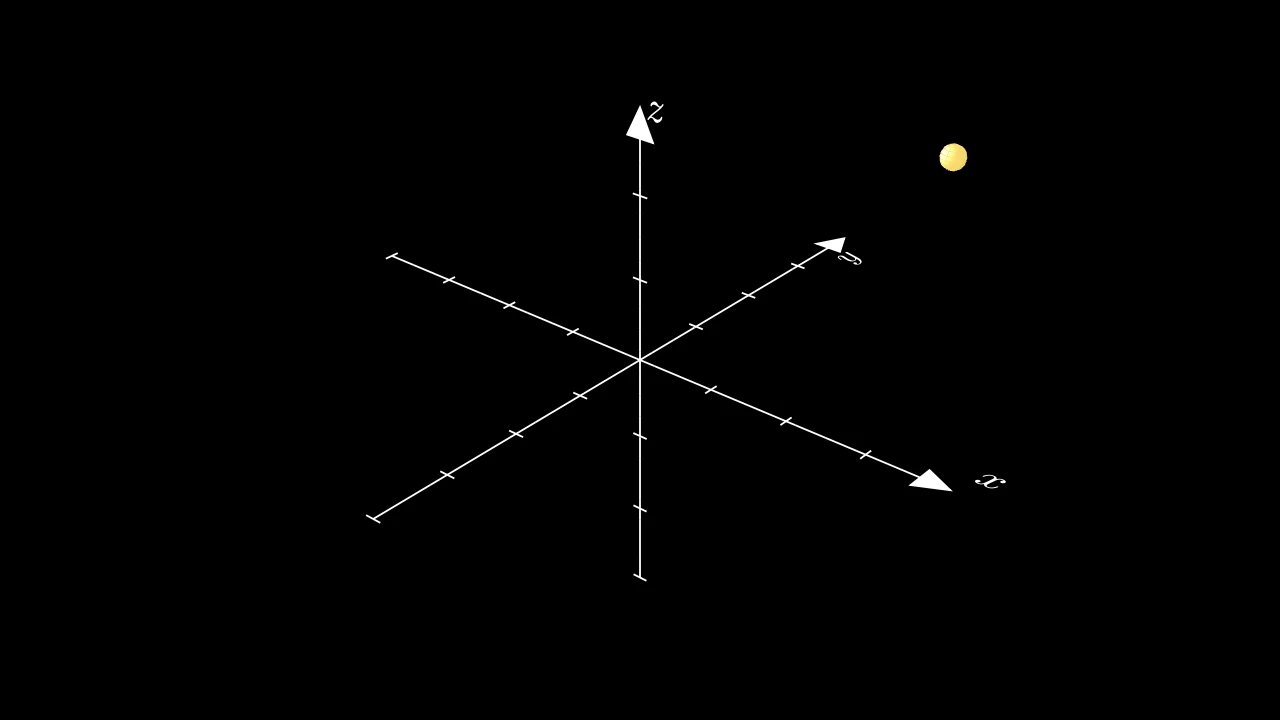
ThreeDAxesExample
代码
import manimgx as m


class ThreeDAxesExample(m.ThreeDScene):
    def construct(self) -> None:
        self.set_camera_orientation(phi=60 * m.DEGREES, theta=-50 * m.DEGREES)
        axes = m.ThreeDAxes(
            x_range=(-4, 4),
            y_range=(-4, 4),
            z_range=(-3, 3),
            x_length=8,
            y_length=8,
            z_length=6,
        )
        dot = m.Dot3D(axes.c2p(2, 3, 2), radius=0.15, color=m.YELLOW)
        self.add(axes, axes.get_axis_labels(), dot)

三维坐标轴:一条 z 轴指出屏幕,过 x 轴和 y 轴的原点;未配置时为白色,带箭头,并由三维场景的光线着色。

z 轴与其他坐标轴一样创建,在 z_range 上运行,指向 OUT,在其 0 处(或其范围最接近 0 的端点处)与它们交叉。每个坐标轴绘制为短段,按三维对象的方式着色,带朝向光的轻微光泽。坐标用三个数字转换,axes.c2p(x, y, z),Axes 能做的一切,这些坐标轴也能。从正上方看,它们看起来像二维坐标轴:转动相机(set_camera_orientation)以看到其深度。

常用的坐标轴选项在构造开始时捕获;每个完成的数轴保留其自身的运行时默认值。

m.ThreeDAxes(x_range=(-6, 6, 1), y_range=(-5, 5, 1), z_range=(-4, 4, 1), x_length=None, y_length=None, z_length=None, z_axis_config=None, **kwargs)
x_range

x 轴的范围,[x_min, x_max, x_step],或 [x_min, x_max] 表示步长为 1;None 表示 [-7, 7, 1]。

y_range

y 轴的范围,同上;None 表示 [-4, 4, 1]。

z_range

z 轴的范围,同上;None 表示 [-7, 7, 1]。

x_length

x 轴的长度,以场景单位计;None 表示画框短边加 2.5(宽视频和高视频中为 10.5),或坐标轴配置给出时每单位 unit_size。

y_length

y 轴的长度,以场景单位计;None 也表示 10.5,或坐标轴配置给出时每单位 unit_size。

z_length

z 轴的长度,以场景单位计;None 表示画框短边减 1.5(6.5),或坐标轴配置给出时每单位 unit_size。

z_axis_config

z 轴的 数轴关键字,覆盖 axis_config 的;None 表示无。

axis_config

每个坐标轴的 数轴关键字:include_numbers、font_size、color、…(默认 None:无)。

x_axis_config

x 轴的数轴关键字,覆盖 axis_config 的(默认 None:无)。

y_axis_config

y 轴的数轴关键字,覆盖 axis_config 的(默认 None:无)。

tips

每个坐标轴末端是否有箭头(默认 True;平面的坐标轴无箭头,除非 axis_config 包含 include_tip)。

color

填充与描边共用的颜色(默认白色);None 表示该类的默认值。

fill_color

填充的颜色;未给出时为 color。多个颜色沿 sheen_direction 构成渐变。

fill_opacity

填充的不透明度,取值从 0 到 1(默认 0:无填充)。

stroke_color

描边的颜色;未给出时为 color。多个颜色构成渐变。

stroke_opacity

描边的不透明度,取值从 0 到 1(默认 1)。

stroke_width

描边的宽度,以场景单位的百分之一计(默认 4;0:无描边)。

background_stroke_color

绘制于填充之后的轮廓颜色(默认黑色)。

background_stroke_opacity

轮廓的不透明度,取值从 0 到 1(默认 1)。

background_stroke_width

轮廓的宽度,以场景单位的百分之一计(默认 0:无)。

sheen_factor

颜色朝 sheen_direction 变亮的程度,取值从 -1 到 1(默认 0); 负值变暗。

sheen_direction

颜色变亮的方向(默认 UL)。

joint_type

描边在路径转折处的连接方式:圆角、斜切或斜接,按二维场景的绘制方式 (参见 LineJointType;默认 AUTO:斜接)。

cap_style

描边在其显示的每一端的端点样式(开放路径的端点、虚线的端点):圆头、平头 或方头,按二维场景的绘制方式(参见 CapStyleType;默认 AUTO:平头)。

shade_in_3d

三维场景的光是否对该 mobject 着色。

material

其表面在三维场景中如何反射场景的光(参见 Material);None:Manim 的着色(默认)。

name

mobject 的名称;未给出时为其类名。

z_index

其在绘制顺序中的位置:索引较高者绘制于较低者之上 (默认 0)。

target

MoveToTarget 将 mobject 移动至的状态。

源码

manimgx\mobjects\plotting.py

def __init__(
    self,
    x_range: Sequence[float] | None = (-6, 6, 1),
    y_range: Sequence[float] | None = (-5, 5, 1),
    z_range: Sequence[float] | None = (-4, 4, 1),
    x_length: float | None = None,
    y_length: float | None = None,
    z_length: float | None = None,
    z_axis_config: NumberLineOptions | None = None,
    **kwargs: Unpack[AxesOptions],
):
    axis_config = merged_axis_config(
        {"include_tip": kwargs.get("tips", True), "numbers_to_exclude": [0]},
        kwargs.get("axis_config"),
    )
    kwargs["axis_config"] = axis_config
    super().__init__(
        x_range=x_range,
        x_length=x_length,
        y_range=y_range,
        y_length=y_length,
        **kwargs,
    )
    self.z_range = z_range
    """z 轴的范围,按给出时的形式。"""
    z_axis_config = _origin_tick(merged_axis_config(axis_config, z_axis_config))
    self.dimension = 3
    z_axis = self._create_axis(self.z_range, z_axis_config, z_length, 2)
    z_origin = _origin_shift([z_axis.x_min, z_axis.x_max])
    z_axis.rotate_about_number(z_origin, -PI / 2, UP)
    z_axis.rotate_about_number(z_origin, angle_of_vector(DOWN))
    z_axis.shift(-z_axis.number_to_point(z_origin))
    z_axis.shift(
        self.x_axis.number_to_point(
            _origin_shift([self.x_axis.x_min, self.x_axis.x_max])
        )
    )
    self.axes.add(z_axis)
    self.add(z_axis)
    self.z_axis = z_axis
    """z 轴,一个 [NumberLine][manimgx.NumberLine]。"""
    self.z_length = z_axis.get_length()
    self._add_3d_pieces()
    self._set_axis_shading()

z_range

z 轴的范围,按给出时的形式。

z_axis

z 轴,一个 NumberLine。

get_y_axis_label

为 y 轴制作标签,在其末端处,旋转以沿其放置。

字符串或数字用坐标轴的 label_constructor 排版(默认按数学排版,用 MathTex);mobject 按原样使用。标签放在坐标轴的某个角旁,朝 direction 方向,若在屏幕外则移回屏幕上,然后绕其中心旋转。

three_daxes.get_y_axis_label(label, edge=UR, direction=UR, buff=SMALL_BUFF, rotation=PI / 2, rotation_axis=OUT)
label

标签:字符串、数字或 mobject。

edge

标签所放的坐标轴的角,作为方向:UR,即右上角,在其末端处。

direction

标签从该角放置的方向。

buff

角与标签之间的间距,以场景单位计。

rotation

标签旋转的角度,以弧度计:四分之一圈,逆时针方向。

rotation_axis

旋转所绕的轴:OUT 使其在 xy 平面内旋转。

返回 标签,未添加到坐标轴。

源码

manimgx\mobjects\plotting.py

def get_y_axis_label(
    self,
    label: Label,
    edge: Vector3DLike = UR,
    direction: Vector3DLike = UR,
    buff: float = SMALL_BUFF,
    rotation: float = PI / 2,
    rotation_axis: Vector3DLike = OUT,
) -> Mobject:
    """为 y 轴制作标签,在其末端处,旋转以沿其放置。

    字符串或数字用坐标轴的 `label_constructor` 排版(默认按数学排版,用 [MathTex][manimgx.MathTex]);mobject 按原样使用。标签放在坐标轴的某个角旁,朝 `direction` 方向,若在屏幕外则移回屏幕上,然后绕其中心旋转。

    Args:
        label: 标签:字符串、数字或 mobject。
        edge: 标签所放的坐标轴的角,作为方向:UR,即右上角,在其末端处。
        direction: 标签从该角放置的方向。
        buff: 角与标签之间的间距,以场景单位计。
        rotation: 标签旋转的角度,以弧度计:四分之一圈,逆时针方向。
        rotation_axis: 旋转所绕的轴:OUT 使其在 xy 平面内旋转。

    Returns:
        标签,未添加到坐标轴。
    """
    placed = super().get_y_axis_label(label, edge, direction, buff)
    return placed.rotate(rotation, axis=rotation_axis)

get_z_axis_label

为 z 轴制作标签,在其末端处,竖立放置。

字符串或数字用坐标轴的 label_constructor 排版(默认按数学排版,用 MathTex);mobject 按原样使用。标签放在坐标轴末端旁,朝 direction 方向,若在屏幕外则移回屏幕上,然后绕其中心旋转:默认绕 RIGHT 四分之一圈,使其从 xy 平面立起。

three_daxes.get_z_axis_label(label, edge=OUT, direction=RIGHT, buff=SMALL_BUFF, rotation=PI / 2, rotation_axis=RIGHT)
label

标签:字符串、数字或 mobject。

edge

标签所放的坐标轴的点,作为方向:OUT,即其末端。

direction

标签从该点放置的方向。

buff

点与标签之间的间距,以场景单位计。

rotation

标签旋转的角度,以弧度计。

rotation_axis

旋转所绕的轴。

返回 标签,未添加到坐标轴。

源码

manimgx\mobjects\plotting.py

def get_z_axis_label(
    self,
    label: Label,
    edge: Vector3DLike = OUT,
    direction: Vector3DLike = RIGHT,
    buff: float = SMALL_BUFF,
    rotation: float = PI / 2,
    rotation_axis: Vector3DLike = RIGHT,
) -> Mobject:
    """为 z 轴制作标签,在其末端处,竖立放置。

    字符串或数字用坐标轴的 `label_constructor` 排版(默认按数学排版,用 [MathTex][manimgx.MathTex]);mobject 按原样使用。标签放在坐标轴末端旁,朝 `direction` 方向,若在屏幕外则移回屏幕上,然后绕其中心旋转:默认绕 RIGHT 四分之一圈,使其从 xy 平面立起。

    Args:
        label: 标签:字符串、数字或 mobject。
        edge: 标签所放的坐标轴的点,作为方向:OUT,即其末端。
        direction: 标签从该点放置的方向。
        buff: 点与标签之间的间距,以场景单位计。
        rotation: 标签旋转的角度,以弧度计。
        rotation_axis: 旋转所绕的轴。

    Returns:
        标签,未添加到坐标轴。
    """
    placed = self._get_axis_label(label, self.z_axis, edge, direction, buff)
    return placed.rotate(rotation, axis=rotation_axis)

get_axis_labels

为每个坐标轴制作标签,在其末端处,按 get_x_axis_label、get_y_axis_label 和 get_z_axis_label 的放置方式。

three_daxes.get_axis_labels(x_label='x', y_label='y', z_label='z')
x_label

x 轴的标签:字符串或数字,按数学排版,或 mobject。

y_label

y 轴的标签,同上。

z_label

z 轴的标签,同上。

返回 标签的新组,保留为坐标轴的 axis_labels;未添加到坐标轴。

源码

manimgx\mobjects\plotting.py

def get_axis_labels(
    self, x_label: Label = "x", y_label: Label = "y", z_label: Label = "z"
) -> VGroup:
    """为每个坐标轴制作标签,在其末端处,按 [get_x_axis_label][manimgx.Axes.get_x_axis_label]、[get_y_axis_label][manimgx.ThreeDAxes.get_y_axis_label] 和 [get_z_axis_label][manimgx.ThreeDAxes.get_z_axis_label] 的放置方式。

    Args:
        x_label: x 轴的标签:字符串或数字,按数学排版,或 mobject。
        y_label: y 轴的标签,同上。
        z_label: z 轴的标签,同上。

    Returns:
        标签的新组,保留为坐标轴的 `axis_labels`;未添加到坐标轴。
    """
    self.axis_labels = VGroup(
        self.get_x_axis_label(x_label),
        self.get_y_axis_label(y_label),
        self.get_z_axis_label(z_label),
    )
    return self.axis_labels

AxisLine

从坐标轴到点的线的关键字 (get_vertical_line 等):其类、其关键字、其颜色和其宽度。

line_func

线的类(默认 DashedLine;Line 是实线)。

line_config

线的 虚线关键字,但不包括其颜色和宽度,由 color 和 stroke_width 设置(默认 None:无)。

color

线的颜色(默认 None:白色)。

stroke_width

线的宽度,以场景单位的百分之一计(默认 2)。

line_func

线的类(默认 DashedLine;Line 是实线)。

line_config

线的 虚线关键字,但不包括其颜色和宽度,由 color 和 stroke_width 设置(默认 None:无)。

color

线的颜色(默认 None:白色)。

stroke_width

线的宽度,以场景单位的百分之一计(默认 2)。

AxesOptions

Axes 除范围和长度外的关键字,用于传递它们的类(ThreeDAxes、平面、BarChart):其坐标轴的配置和箭头,附带样式关键字。

axis_config

每个坐标轴的 数轴关键字:include_numbers、font_size、color、…(默认 None:无)。

x_axis_config

x 轴的数轴关键字,覆盖 axis_config 的(默认 None:无)。

y_axis_config

y 轴的数轴关键字,覆盖 axis_config 的(默认 None:无)。

tips

每个坐标轴末端是否有箭头(默认 True;平面的坐标轴无箭头,除非 axis_config 包含 include_tip)。

color

填充与描边共用的颜色(默认白色);None 表示该类的默认值。

fill_color

填充的颜色;未给出时为 color。多个颜色沿 sheen_direction 构成渐变。

fill_opacity

填充的不透明度,取值从 0 到 1(默认 0:无填充)。

stroke_color

描边的颜色;未给出时为 color。多个颜色构成渐变。

stroke_opacity

描边的不透明度,取值从 0 到 1(默认 1)。

stroke_width

描边的宽度,以场景单位的百分之一计(默认 4;0:无描边)。

background_stroke_color

绘制于填充之后的轮廓颜色(默认黑色)。

background_stroke_opacity

轮廓的不透明度,取值从 0 到 1(默认 1)。

background_stroke_width

轮廓的宽度,以场景单位的百分之一计(默认 0:无)。

sheen_factor

颜色朝 sheen_direction 变亮的程度,取值从 -1 到 1(默认 0); 负值变暗。

sheen_direction

颜色变亮的方向(默认 UL)。

joint_type

描边在路径转折处的连接方式:圆角、斜切或斜接,按二维场景的绘制方式 (参见 LineJointType;默认 AUTO:斜接)。

cap_style

描边在其显示的每一端的端点样式(开放路径的端点、虚线的端点):圆头、平头 或方头,按二维场景的绘制方式(参见 CapStyleType;默认 AUTO:平头)。

shade_in_3d

三维场景的光是否对该 mobject 着色。

material

其表面在三维场景中如何反射场景的光(参见 Material);None:Manim 的着色(默认)。

name

mobject 的名称;未给出时为其类名。

z_index

其在绘制顺序中的位置:索引较高者绘制于较低者之上 (默认 0)。

target

MoveToTarget 将 mobject 移动至的状态。